. 2013 May 6;210(5):969-85.
doi: 10.1084/jem.20121187. Epub 2013 Apr 8.

Coordinated transcriptional regulation of bone homeostasis by Ebf1 and Zfp521 in both mesenchymal and hematopoietic lineages

Affiliations

Coordinated transcriptional regulation of bone homeostasis by Ebf1 and Zfp521 in both mesenchymal and hematopoietic lineages

Riku Kiviranta et al. J Exp Med. .

Abstract

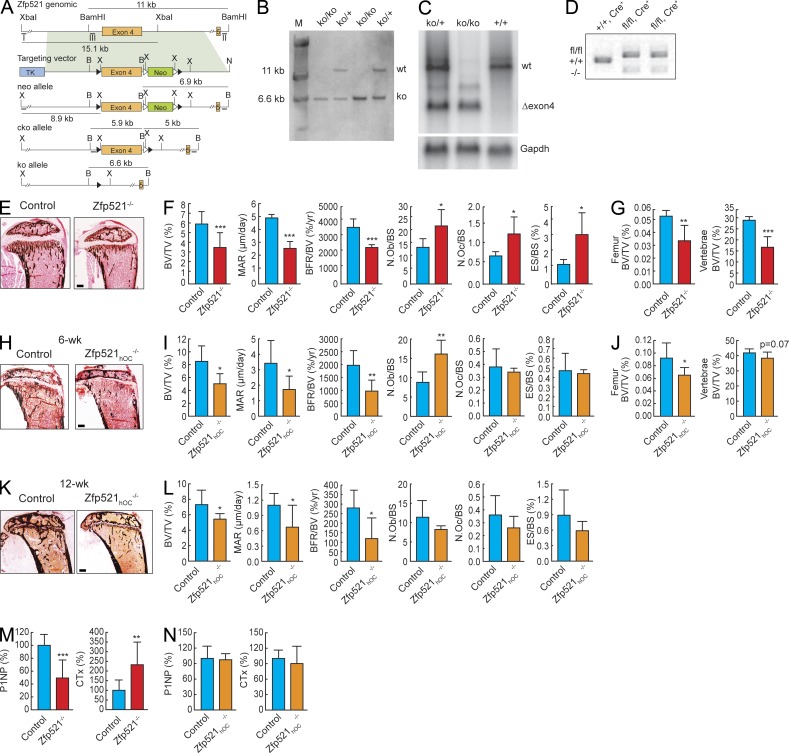
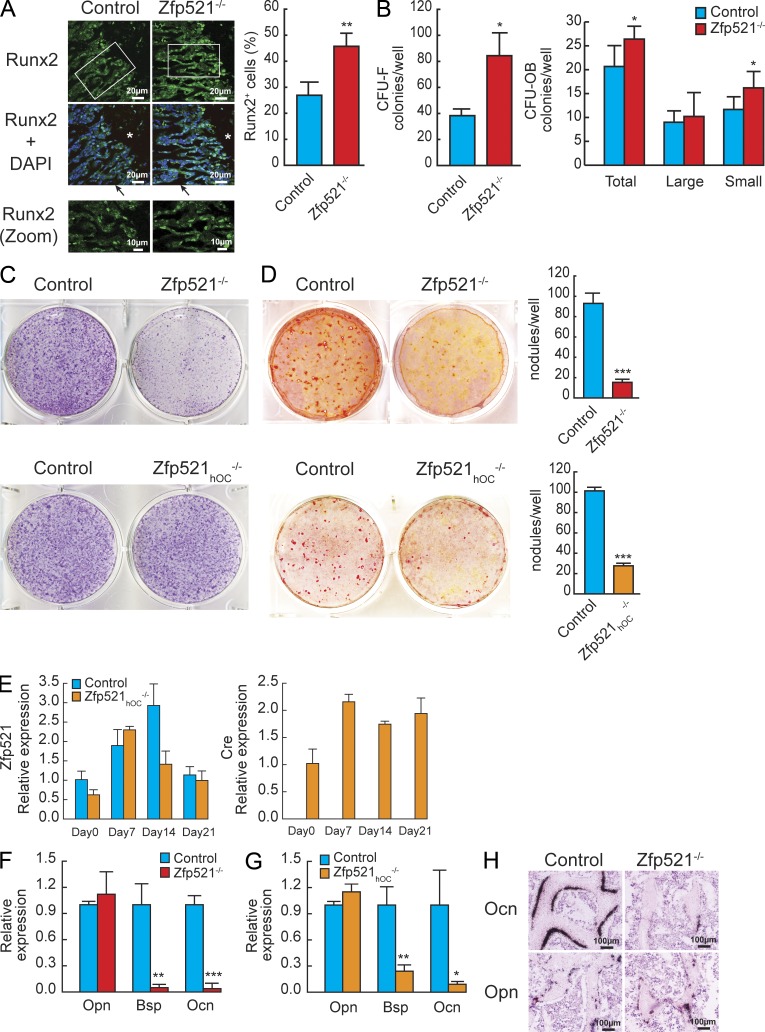
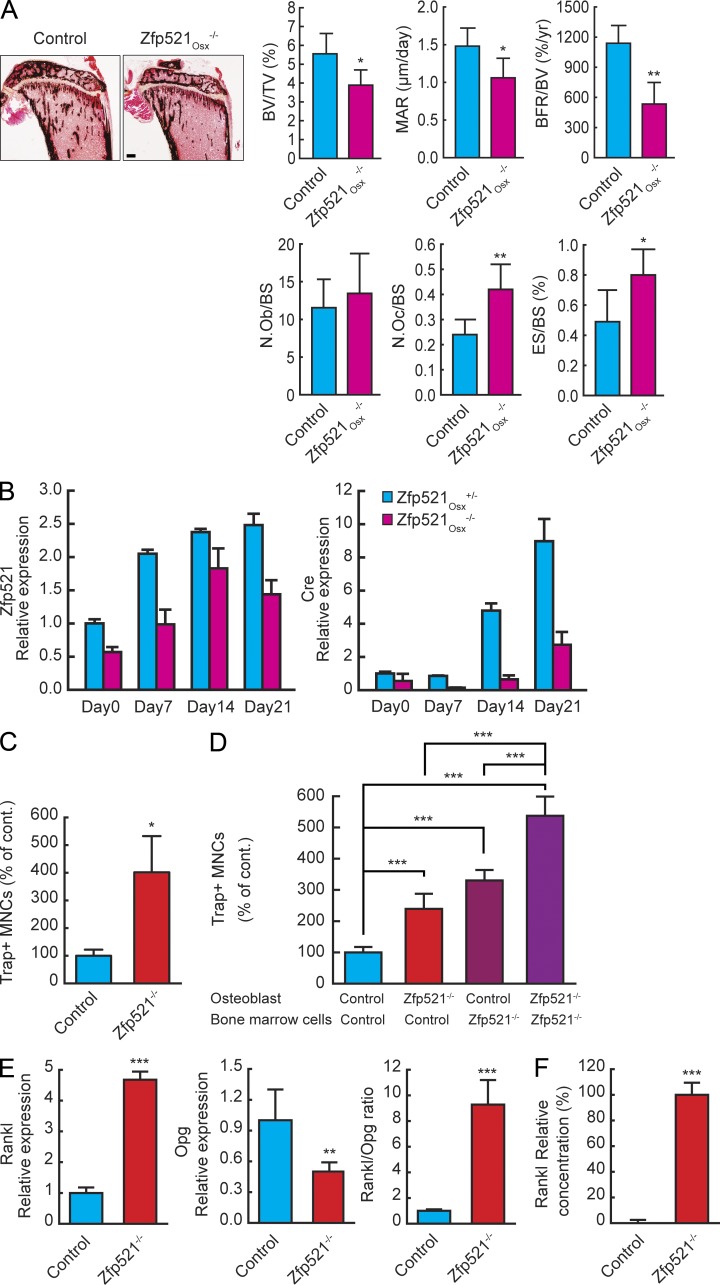
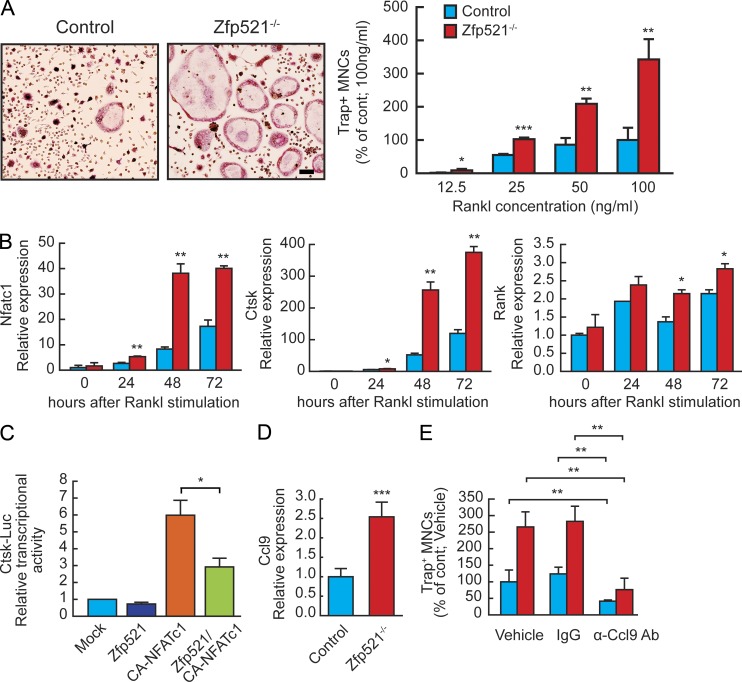
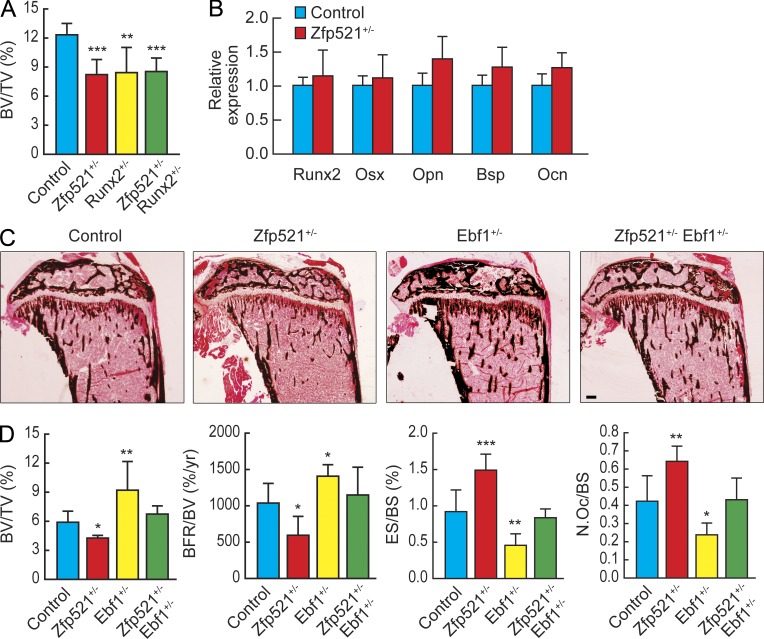
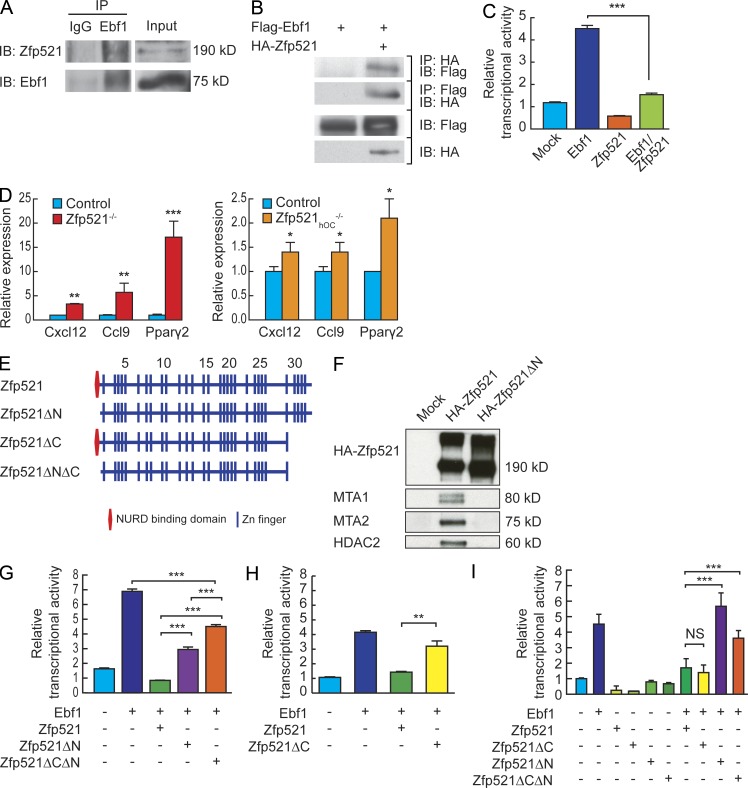
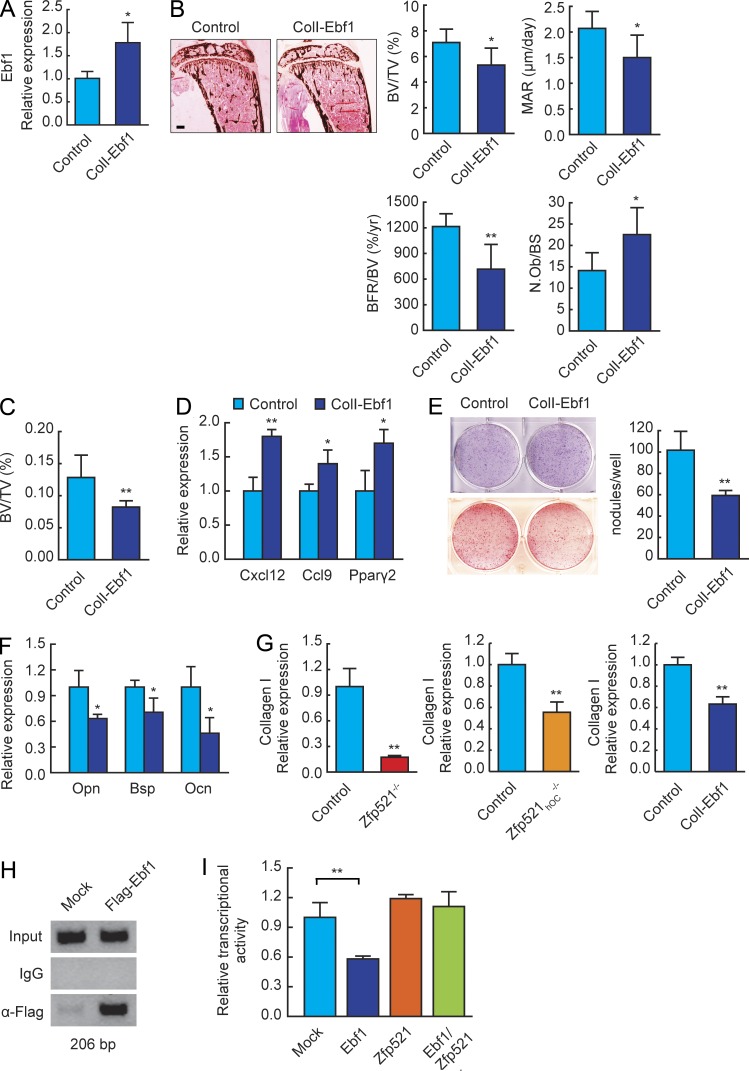
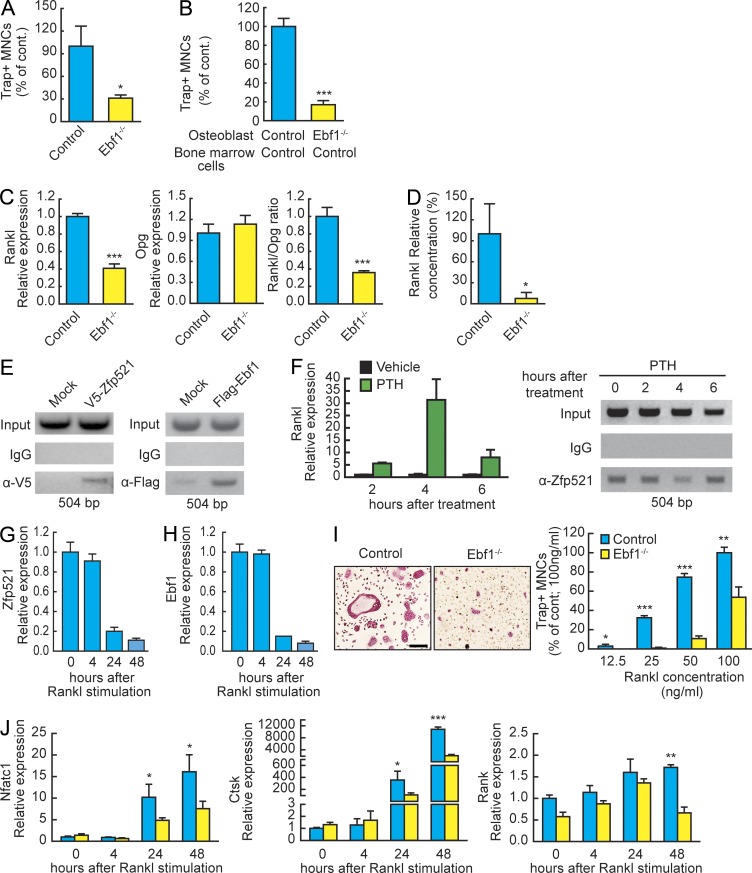
Bone homeostasis is maintained by the coupled actions of hematopoietic bone-resorbing osteoclasts (OCs) and mesenchymal bone-forming osteoblasts (OBs). Here we identify early B cell factor 1 (Ebf1) and the transcriptional coregulator Zfp521 as components of the machinery that regulates bone homeostasis through coordinated effects in both lineages. Deletion of Zfp521 in OBs led to impaired bone formation and increased OB-dependent osteoclastogenesis (OC-genesis), and deletion in hematopoietic cells revealed a strong cell-autonomous role for Zfp521 in OC progenitors. In adult mice, the effects of Zfp521 were largely caused by repression of Ebf1, and the bone phenotype of Zfp521(+/-) mice was rescued in Zfp521(+/-):Ebf1(+/-) mice. Zfp521 interacted with Ebf1 and repressed its transcriptional activity. Accordingly, deletion of Zfp521 led to increased Ebf1 activity in OBs and OCs. In vivo, Ebf1 overexpression in OBs resulted in suppressed bone formation, similar to the phenotype seen after OB-targeted deletion of Zfp521. Conversely, Ebf1 deletion led to cell-autonomous defects in both OB-dependent and cell-intrinsic OC-genesis, a phenotype opposite to that of the Zfp521 knockout. Thus, we have identified the interplay between Zfp521 and Ebf1 as a novel rheostat for bone homeostasis.


Figures

Figure 1.
Figure 1.
Zfp521 favors bone formation in mature OBs. (A) Generation of null and conditional Zfp521 alleles. Zfp521 genomic region encoding exon 4 is shown. Restriction fragment sizes are indicated as well as the positions of the internal and the two flanking probes used for genotyping analysis (Roman numerals). The shaded area indicates the part of the genomic region included in the targeting vector, and the three different alleles are shown. “neo” is the result of the gene-targeting event. “cko” is the conditional knockout allele derived from the neo allele after Flpe-mediated excision of the PGK-neo cassette. One Frt site and two loxP sites remain in the locus. “ko” is the null allele derived from the “neo” or from the “cko” allele by Cre-mediated recombination between the two loxP sites. Only a single loxP site remains in the modified locus. Splicing of exon 3 to exon 5 generates a frameshift. loxP and Frt sites are indicated as closed and open triangles, respectively. Neo, PGK-em7-neomycin dual selection cassette for bacteria and embryonic stem cells; TK, thymidine kinase cassette for counter-selection in embryonic stem cells; X, XbaI; B, BamHI; N, NotI. The genomic region is not drawn to scale. (B) Results of a Southern blot analysis of BamHI-digested tail DNA, probed with the internal probe (III). (C) Northern blot analysis of whole-brain RNA from 3-wk-old mice using a full-length Zfp521 cDNA probe. The blot was rehybridized with a Gapdh probe as a control for RNA quality. wt, wild type; Δexon4, position of the residual mRNA after removal of exon 4. (D) Genotyping PCR showing deletion of Zfp521 allele in genomic DNA extracted from Zfp521hOC−/− long bones cleaned of soft tissues and BM. (E) Von Kossa staining of tibia sections in 3-wk-old global Zfp521−/− mice and Zfp521+/+ littermate controls. (F) Histomorphometric analysis of samples in E (n = 5). (G) Trabecular BV (BV/tissue volume [TV]) at distal femoral metaphysis and in second lumbar vertebra in 3-wk-old Zfp521−/− and control mice measured by μCT (n = 5). (H) Von Kossa staining of tibia sections in 6-wk-old Zfp521hOC−/− mice and littermate controls. (I) Histomorphometric analysis of samples in H (n = 6). (J) Trabecular BV (BV/TV) at distal femoral metaphysis and in second lumbar vertebra in 12-wk-old Zfp521hOC−/− and control mice measured by μCT (n = 5–6). (K) Von Kossa staining of tibia sections in 12-wk-old Zfp521hOC−/− mice and littermate controls. (L) Histomorphometric analysis of samples in K (n = 6). (M) Serum PINP and CTX levels in 3-wk-old global Zfp521−/− mice and Zfp521+/+ littermate controls (n = 6–9). (N) Serum PINP and CTX levels in 6-wk-old Zfp521hOC−/− and control mice (n = 5–6). N.Ob, number of OBs; N.Oc, number of OCs. All data are means ± SD. *, P < 0.05; **, P < 0.01; ***, P < 0.001. Bars: (E) 400 μm; (H and K) 600 μm. See also Tables S1–S3.
Figure 2.
Figure 2.
Zfp521 is required for OB maturation. (A) Cryosections of 3-wk-old Zfp521−/− and control mice showing the distal femoral metaphysis were immunostained for Runx2 (green). Nuclear DAPI staining (dark blue) and colocalization with Runx2 (light blue) are shown. Higher magnification images of the marked areas show trabecular surfaces. Asterisks indicate the growth plate, and arrows indicate the trabecular bone. Bar graph shows the ratio of Runx2+/total cell number quantified in the primary spongiosa from confocal images (n = 3 mice/genotype). (B) An equal number of BM cells flushed from Zfp521−/− and control mice was plated on 6-well plates and cultured in osteogenic medium (OM) for 10 and 21 d. The cells were stained for ALP activity on day 10 to count the number of CFU-Fs and with Alizarin red for osteoblastic colonies (CFU-OB) on day 21. (C) Calvarial cells from Zfp521−/−, Zfp521hOC−/−, and respective control newborn mice were harvested and cultured on 6-well plates for 7 d in OM and stained for ALP activity. (D) Zfp521−/−, Zfp521hOC−/−, and control calvarial cells were cultured for 21 d in OM and stained with Alizarin red to detect mineralized bone nodules. Alizarin red–positive nodules were quantified (bar graphs). (E) Time course of Zfp521 and hOC-Cre expression in Zfp521hOC−/− and control calvarial cells during OB differentiation was measured using quantitative RT-PCR (qRT-PCR) in RNA extracted from cultures in C and D. (F) Expression of late OB marker genes Bsp and Ocn was measured by qRT-PCR in Zfp521−/− and control calvarial cells cultured for 21 d in OM. (G) Expression of late OB marker genes Bsp and Ocn was measured by qRT-PCR in Zfp521hOC−/− and control calvarial cells cultured for 21 d in OM. (H) Expression of early (Opn) and late (Ocn) marker genes by in situ hybridization in Zfp521−/− and control bones. All data are means ± SD. Similar results were obtained in at least three separate experiments performed in triplicate. *, P < 0.05; **, P < 0.01; ***, P < 0.001.
Figure 3.
Figure 3.
Zfp521 controls OB-dependent OC-genesis. (A) Von Kossa staining and histomorphometric analysis of tibia sections in 6-wk-old Zfp521Osx−/− mice and littermate controls (n = 6–8). N.Ob, number of OBs; N.Oc, number of OCs; TV, tissue volume. Bar, 520 μm. (B) Calvarial cells from Zfp521Osx−/− and control newborn mice were harvested and cultured on 6-well plates in OM. RNA was extracted at the indicated times, and Zfp521 and Osx-Cre expression were measured by qRT-PCR. (C) Total BM cells from Zfp521−/− and control mice were plated on 48-well plates, stimulated with 10 nM hPTH(1–34), and stained for TRAP. Number of TRAP+ multinucleated cells (MNCs) per well is shown. (D) Calvarial and nonadherent BM cells from control and Zfp521−/− mice were mixed as indicated in 24-well plates, stimulated with vitD3 and PGE2, and stained for TRAP. Bar graphs indicate the number of TRAP+ multinucleated cells per well. (E) RNA was extracted from the co-culture experiment in D, and the mRNA expression of Rankl and Opg and the Rankl/Opg ratio were quantified using qRT-PCR. (F) Control and Zfp521−/− calvarial cells were cultured in 24-well plates and stimulated with vitD3 and PGE2 as in co-culture experiments. RANKL concentration in the controls was below detection limit (n = 3). All data are means ± SD. Similar cell number and mRNA data were obtained from at least three experiments with three to six replicates per condition. *, P < 0.05; **, P < 0.01; ***, P < 0.001. See also Table S4.
Figure 4.
Figure 4.
Zfp521 acts in OC progenitor cells to control OC-genesis. (A) Control and Zfp521−/− spleen cells were stimulated with 20 ng/ml M-CSF and then with increasing doses of RANKL for 3 d, stained for TRAP activity, and quantified. Bar, 64 μm. (B) BMM-derived OCs were cultured with 20 ng/ml M-CSF and then M-CSF + 100 ng/ml RANKL for the indicated times, and expression of Nfatc1, Ctsk, and Rank was measured by qRT-PCR. (C) Ctsk-Luciferase reporter construct was transfected to RAW264.7 cells together with Zfp521, constitutively active NFATc1, or both. Luciferase activity was normalized to cotransfected Renilla activity. (D) Nonadherent BM cells were cultured for 2 d with 20 ng/ml M-CSF and then stimulated for 4 h with 100 ng/ml RANKL and 20 ng/ml M-CSF, and expression of Ccl9 was measured by qRT-PCR. (E) Control and Zfp521−/− spleen cells were cultured with 20 ng/ml M-CSF and 50 ng/ml RANKL for 5 d in the presence of blocking anti-Ccl9 antibody, IgG, or vehicle. Cells were fixed and stained for TRAP activity and quantified. All data are means ± SD. Similar cell number and mRNA data were obtained from three independent experiments with three to six replicates per condition. *, P < 0.05; **, P < 0.01; ***, P < 0.001.
Figure 5.
Figure 5.
Ebf1 haploinsufficiency rescues the bone phenotype of Zfp521+/− mice. (A) μCT analysis of tibias from control, Zfp521+/−, Runx2+/−, and Zfp521+/−:Runx2+/− mice at 6 wk (n = 4–6). (B) mRNA expression of Runx2 target genes in Zfp521−/− and control calvarial cells at day 0 of the culture. (C) Von Kossa staining of tibia sections of 6-wk-old control, Zfp521+/−, Ebf1+/−, and Zfp521+/−:Ebf1+/− mice. Bar, 450 μm. (D) Histomorphometric analysis of samples in C (n = 6). All data are means ± SD. Similar mRNA data were obtained from three independent experiments with three replicates per condition. N.Oc, number of OCs; TV, tissue volume. *, P < 0.05; **, P < 0.01; ***, P < 0.001.
Figure 6.
Figure 6.
Zfp521 antagonizes Ebf1 activity. (A) Ebf1 was immunoprecipitated with α-Ebf1 antibody. Mouse IgG was used as control. The immune complexes (left) and 10% input were blotted with α-Ebf1 and α-Zfp521 as indicated. (B) HA-Zfp521 and Flag-Ebf1 proteins were overexpressed in 293T cells. Proteins were immunoprecipitated with α-HA, and the immune complexes (two top panels) and 5% of the original cell lysates (two bottom panels) were blotted with α-HA and α-Flag as indicated. (C) Ebf1-responsive B29-luc plasmid was transfected into 293T cells together with Ebf1, Zfp521, or both. Luciferase activity was normalized to cotransfected Renilla activity. (D) The expression of Ebf1 target genes Cxcl12, Ccl9, and Pparγ was measured by qRT-PCR in Zfp521−/−, Zfp521hOC−/−, and respective control calvarial cells cultured for 7 d in OM. (E) Schematic presentation of Zfp521 domain structure and mutants. (F) HA-Zfp521 and HA-Zfp521ΔN were overexpressed in 293T cells and immunoprecipitated with anti-HA antibody. The Western blot was performed with antibodies against endogenous NuRD complex proteins (MTA1, MTA2, and HDAC2) and anti-HA antibody. (G) B29-luc plasmid was transfected into 293T cells together with Ebf1 and Zfp521 or Zfp521-deletion mutants as indicated. Luciferase activity was normalized to cotransfected Renilla activity. (H) B29-luc plasmid was transfected into 293T cells together with Ebf1 and Zfp521 or Zfp521ΔC as indicated. Luciferase activity was normalized to cotransfected Renilla activity. (I) Ccl9-luc plasmid was transfected into 293T cells together with Ebf1 and Zfp521 or Zfp521-deletion mutants as indicated. Luciferase activity was normalized to cotransfected Renilla activity. All data are means ± SD. Similar results were obtained in at least three independent experiments, and the assays were performed in triplicate. *, P < 0.05; **, P < 0.01; ***, P < 0.001.
Figure 7.
Figure 7.
Ebf1 suppresses bone formation in vivo and in vitro. (A) Ebf1 expression in bone RNA from control and ColI2.3-Ebf1 transgenic mice measured by qRT-PCR (n = 6). (B) Von Kossa staining and histomorphometric analysis of tibia sections in 6-wk-old ColI2.3-Ebf1 transgenic and control mice (n = 6). N.Ob, number of OBs. Bar, 600 μm. (C) Metaphyseal trabecular BV (BV/tissue volume [TV]) in distal femurs of 6-wk-old ColI2.3-Ebf1 mice measured by μCT (n = 6). (D) ColI2.3-Ebf1 and control calvarial cells were harvested from newborn mice, plated on 6-well plates, and cultured in OM for 21 d. Expression of Ebf1 target genes was measured by qRT-PCR. (E) ALP (blue) and Alizarin red (red) staining of ColI2.3-Ebf1 and control calvarial cells cultured in OM for 7 d or 21 d, respectively. Bar graph shows quantification of bone nodules in the Alizarin red–stained plates. (F) Expression of OB marker genes Opn, Bsp, and Ocn in ColI2.3-Ebf1 and control calvarial cells after 21 d in OM was measured by qRT-PCR. (G) Col1a1 expression in Zfp521−/−, Zfp521hOC−/−, and ColI2.3-Ebf1 and respective control calvarial cells after 21 d in OM was measured by qRT-PCR. (H) Ebf1-containing chromatin complexes were immunoprecipitated from control and Flag-Ebf1–overexpressing MC3T3-E1 cells using anti-Flag antibody. IgG was used as negative control. The region of the ColI2.3kb promoter containing the putative Ebf1-binding site was amplified by PCR. (I) ColI2.3kb-luc reporter was transfected into C3H10T1/2 cells together with Ebf1, Zfp521, or both. Luciferase activity was normalized to cotransfected Renilla activity. All data are mean ± SD. Similar mRNA and reporter assay data were obtained from at least three experiments performed in triplicate. *, P < 0.05; **, P < 0.01.
Figure 8.
Figure 8.
Ebf1 and Zfp521 regulate OB-dependent and hematopoietic lineage–dependent OC-genesis. (A) Total BM cells from Ebf1−/− and control mice were plated on 48-well plates, stimulated with 10 nM hPTH(1–34), and stained for TRAP. Number of TRAP+ multinucleated cells (MNCs) per well is shown. (B) Calvarial cells from control and Ebf1−/− mice were co-cultured with nonadherent BM cells as indicated in 24-well plates, stimulated with vitD3 and PGE2, and stained for TRAP. Bar graphs indicate the number of TRAP+ multinucleated cells per well. (C) Rankl and Opg mRNA expression and Rankl/Opg ratio measured by qRT-PCR in the co-culture experiment in B. (D) RANKL protein levels were measured with RANKL ELISA in medium samples from control and Ebf1−/− calvarial cells cultured in 12-well plates and stimulated with vitD3 and PGE2 as in co-culture experiments (n = 3). (E) ChIP with anti-V5 antibody for V5-Zfp521 and anti-Flag antibody for Flag-Ebf1 in MC3T3-E1 cells overexpressing the tagged proteins. IgG was used as control. The PCR-amplified promoter area contained a putative Ebf1 consensus site in the active distal promoter region. (F) The time courses of PTH-induced Rankl mRNA expression and displacement and rebinding of endogenous Zfp521 from the Rankl distal promoter region after stimulation by 10 nM PTH were compared. Zfp521 binding to the promoter was analyzed in a ChIP assay using the anti-Zfp521 antibody. IgG was used as control. (G) Expression of Zfp521 mRNA by qRT-PCR in OC progenitors cultured with 20 ng/ml M-CSF for 2 d and then stimulated with 100 ng/ml RANKL for the indicated times. (H) Expression of Ebf1 mRNA by qRT-PCR in OC progenitors cultured as in G. (I) Control and Ebf1−/− spleen cells were stimulated with 20 ng/ml M-CSF and then with increasing doses of RANKL for 5 d, stained for TRAP activity, and quantified. Bar, 100 μm. (J) Expression of Nfatc1, Ctsk, and Rank mRNAs by qRT-PCR in Ebf1−/− spleen cell–derived OCs cultured with 20 ng/ml M-CSF and then M-CSF + 100 ng/ml RANKL for the indicated times. All data are mean ± SD. Similar cell number and mRNA data were obtained from three independent experiments with four to six replicates per condition. *, P < 0.05; **, P < 0.01; ***, P < 0.001.

References

    1. Almeida M. 2011. Unraveling the role of FoxOs in bone—insights from mouse models. Bone. 49:319–327 10.1016/j.bone.2011.05.023 - DOI - PMC - PubMed
    1. Bond H.M., Mesuraca M., Carbone E., Bonelli P., Agosti V., Amodio N., De Rosa G., Di Nicola M., Gianni A.M., Moore M.A., et al. 2004. Early hematopoietic zinc finger protein (EHZF), the human homolog to mouse Evi3, is highly expressed in primitive human hematopoietic cells. Blood. 103:2062–2070 10.1182/blood-2003-07-2388 - DOI - PubMed
    1. Boyle W.J., Simonet W.S., Lacey D.L. 2003. Osteoclast differentiation and activation. Nature. 423:337–342 10.1038/nature01658 - DOI - PubMed
    1. Bozec A., Bakiri L., Jimenez M., Schinke T., Amling M., Wagner E.F. 2010. Fra-2/AP-1 controls bone formation by regulating osteoblast differentiation and collagen production. J. Cell Biol. 190:1093–1106 10.1083/jcb.201002111 - DOI - PMC - PubMed
    1. Correa D., Hesse E., Seriwatanachai D., Kiviranta R., Saito H., Yamana K., Neff L., Atfi A., Coillard L., Sitara D., et al. 2010. Zfp521 is a target gene and key effector of parathyroid hormone-related peptide signaling in growth plate chondrocytes. Dev. Cell. 19:533–546 10.1016/j.devcel.2010.09.008 - DOI - PMC - PubMed

Publication types

MeSH terms