. 2013 May 6;210(5):1049-63.
doi: 10.1084/jem.20121251. Epub 2013 Apr 8.

Antigen delivery to early endosomes eliminates the superiority of human blood BDCA3+ dendritic cells at cross presentation

Affiliations

Antigen delivery to early endosomes eliminates the superiority of human blood BDCA3+ dendritic cells at cross presentation

Lillian Cohn et al. J Exp Med. .

Abstract

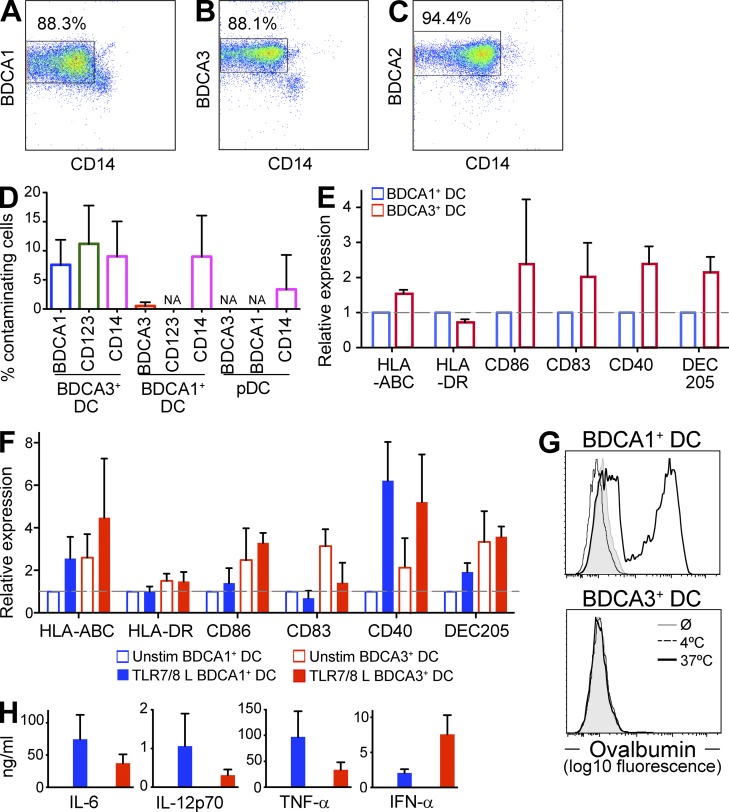
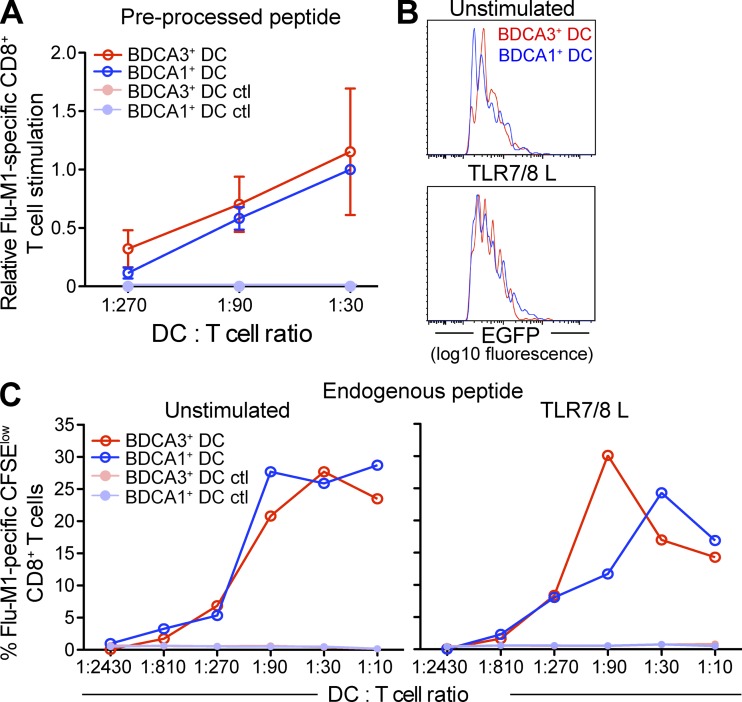
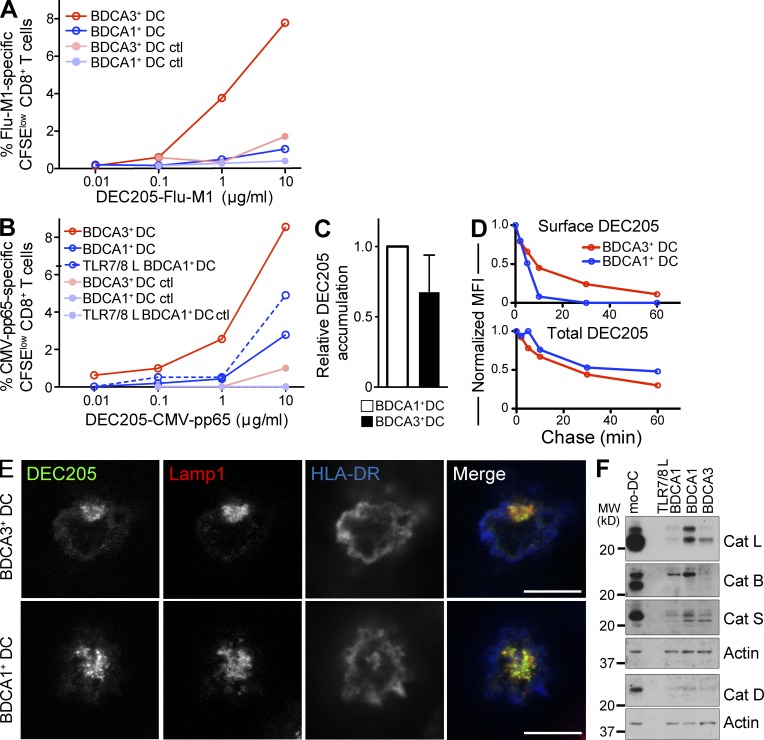
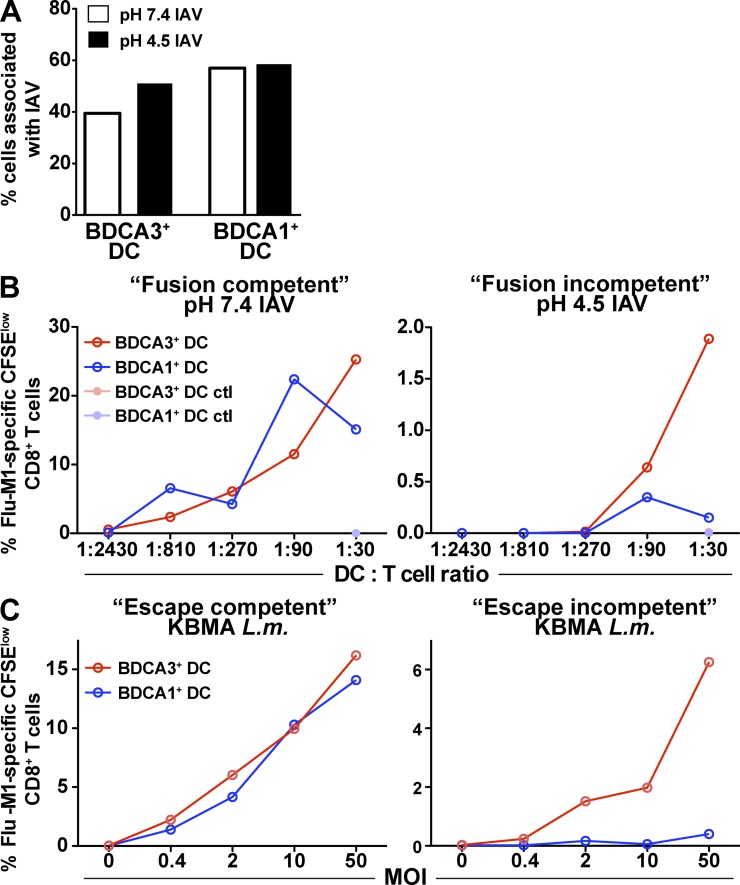
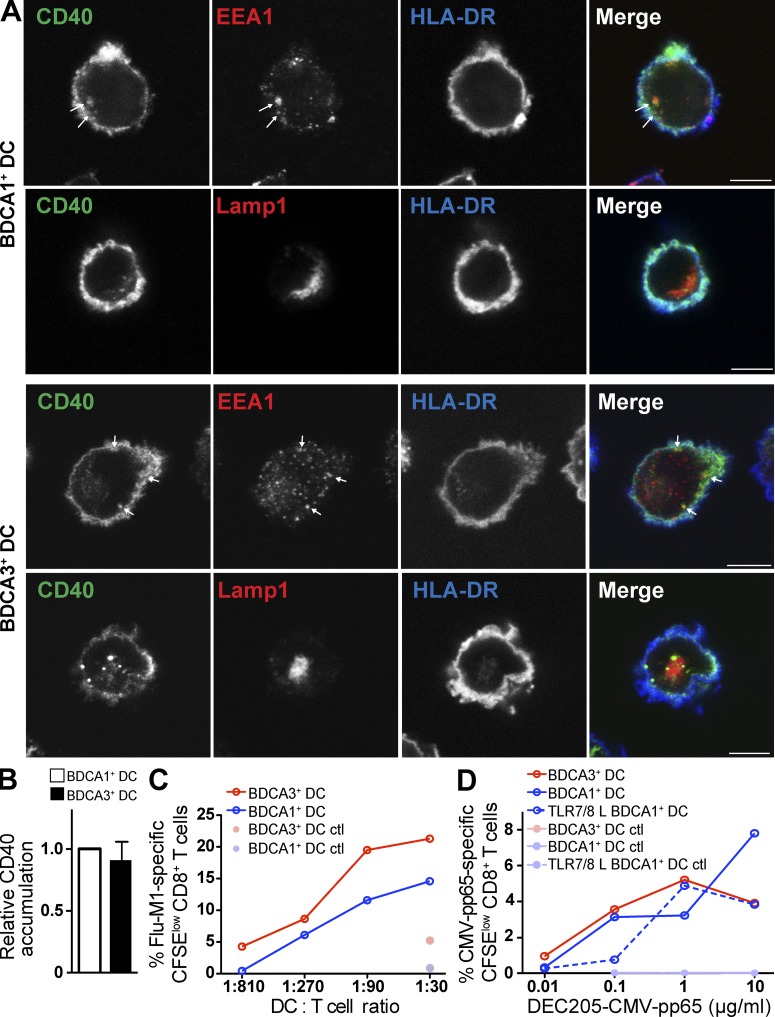
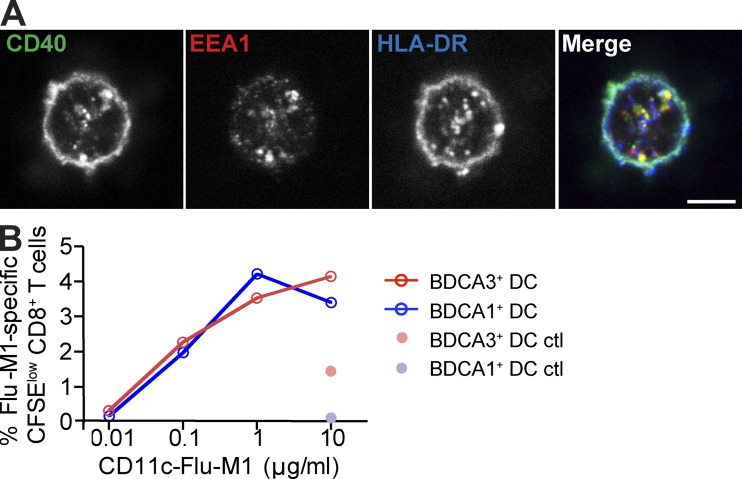
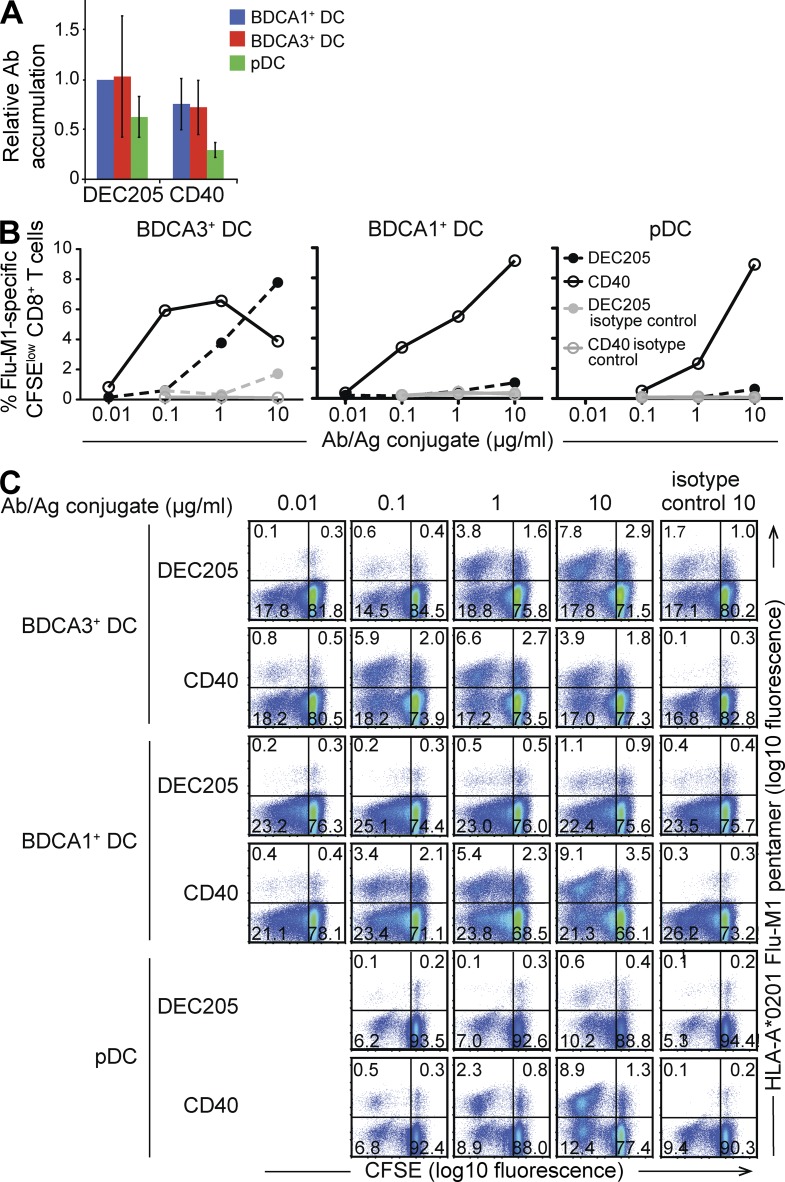
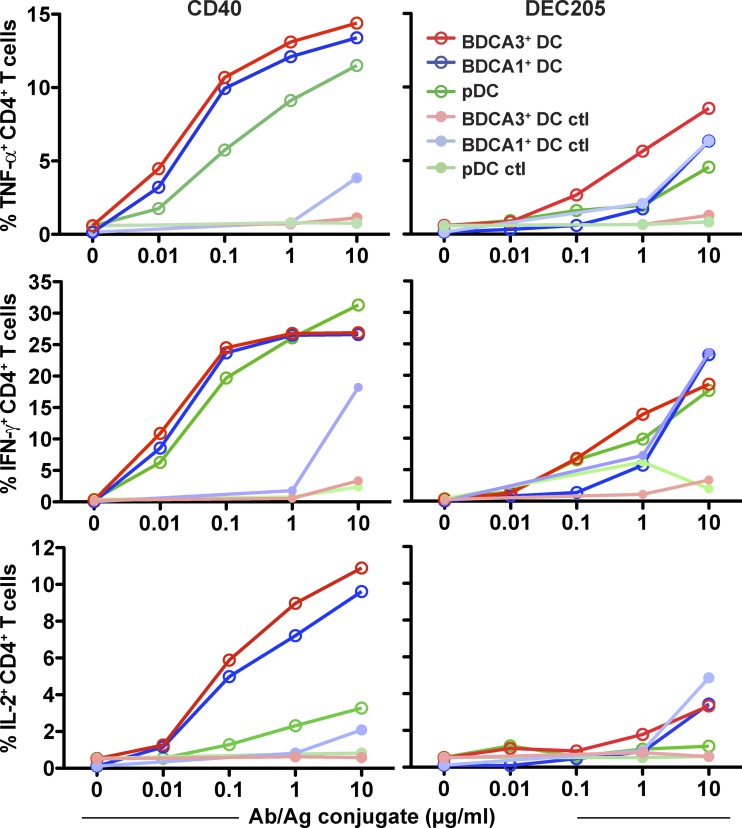
Human BDCA3(+) dendritic cells (DCs), the proposed equivalent to mouse CD8α(+) DCs, are widely thought to cross present antigens on MHC class I (MHCI) molecules more efficiently than other DC populations. If true, it is unclear whether this reflects specialization for cross presentation or a generally enhanced ability to present antigens on MHCI. We compared presentation by BDCA3(+) DCs with BDCA1(+) DCs using a quantitative approach whereby antigens were targeted to distinct intracellular compartments by receptor-mediated internalization. As expected, BDCA3(+) DCs were superior at cross presentation of antigens delivered to late endosomes and lysosomes by uptake of anti-DEC205 antibody conjugated to antigen. This difference may reflect a greater efficiency of antigen escape from BDCA3(+) DC lysosomes. In contrast, if antigens were delivered to early endosomes through CD40 or CD11c, BDCA1(+) DCs were as efficient at cross presentation as BDCA3(+) DCs. Because BDCA3(+) DCs and BDCA1(+) DCs were also equivalent at presenting peptides and endogenously synthesized antigens, BDCA3(+) DCs are not likely to possess mechanisms for cross presentation that are specific to this subset. Thus, multiple DC populations may be comparably effective at presenting exogenous antigens to CD8(+) T cells as long as the antigen is delivered to early endocytic compartments.


Figures

Figure 1.
Figure 1.
BDCA3+ DCs have a more mature phenotype than BDCA1+ DCs. (A–C) Shown are representative plots for BDCA1+ DCs (A), BDCA3+ DCs (B), and pDCs (C) after isolation (representative of n > 20 donors). (D) Percentage of contaminating cells in isolated DC subsets. Isolated DC fractions were labeled for contaminating cell subsets with antibodies against CD14, CD123, BDCA1, or BDCA3. Live cells were gated on the above markers and the percentage of contaminating subsets was determined. Data are the mean ± SD (n = 7 independent experiments). NA, not applicable (below limit of detection). (E) Phenotype of DC subsets in freshly isolated PBMCs. DCs in PBMCs were labeled for the indicated markers and analyzed by flow cytometry. Isotype background fluorescence was subtracted from the mean fluorescence intensity (MFI), and MFI was normalized to unstimulated BDCA1+ DCs. Data are the mean ± SD (n = 6 independent experiments). (F) Phenotype of isolated DC subsets after overnight culture in the presence or absence of TLR7/8 L. After overnight culture, DCs were labeled for the indicated markers and analyzed by flow cytometry. Isotype background fluorescence was subtracted from the MFI, and MFI was normalized to unstimulated BDCA1+ DCs. Data are the mean ± SD (n = 6 independent experiments). (G) Endocytic capacity of isolated DC subsets. Overnight cultured isolated DCs were pulsed with 5 µg/ml Alexa Fluor 488 ovalbumin for 20 min at 37 or 4°C, and ovalbumin uptake was analyzed by flow cytometry. Shown is one representative experiment of three. (H) Cytokine production by isolated DC subsets after overnight culture in the presence or absence of TLR7/8 L. Supernatants were collected and analyzed for indicated cytokine production by Luminex. Data are the mean ± SD (n = 3 independent experiments).
Figure 2.
Figure 2.
BDCA3+ DCs and BDCA1+ DCs have a similar ability to present endogenous antigen on MHCI. (A) Presentation of preprocessed peptide by DCs. Day 1 DCs from HLA-A*0201 donors were incubated with Flu-M1 (aa 58–66) or HIV-p17 (aa 77–85, negative control) peptide at 25 ng/ml for 3 h at 37°C. The cells were then washed and cultured with autologous CFSE-labeled CD8+ T cells at indicated DC/T cell ratio in the presence of TLR7/8 L. 8–10 d later, Flu-M1–specific CD8+ T cell expansion was evaluated by gating on CFSElow cells positive for Flu-M1 (aa 58–66) pentamer. Shown data are normalized to BDCA1+ DC/T cells at a 1:30 ratio and the mean ± SD (n = 4 independent experiments) is depicted. (B) EGFP fluorescence intensity in DC subsets. DCs from HLA-A*0201 donors were transfected directly after isolation with a plasmid encoding for Flu-M1 (aa 55–72)–EGFP fusion protein. DCs were cultured overnight in the presence or absence of TLR7/8 L. 16 h after transfection, DCs were analyzed by flow cytometry for the expression of EGFP. Shown histograms are DCs gated on live EGFP+ cells. Shown is one representative experiment of three. (C) Presentation of endogenous antigen by DCs. Flu-M1 (aa 55–72)-EGFP–transfected DCs were cultured overnight in the presence or absence of TLR7/8 L and then cultured with autologous CFSE-labeled CD8+ T cells at indicated DC/T cell ratios, normalized to percentage of EGFP+ DCs. 8–10 d later, Flu-M1–specific CD8+ T cell expansion was evaluated as in A. Shown is one representative experiment of three.
Figure 3.
Figure 3.
BDCA3+ DC exhibit an enhanced ability to cross present antigen delivered to lysosomes. (A) Antigen cross presentation via DEC205 by BDCA3+ DCs and BDCA1+ DCs. Day 1 DCs from HLA-A*0201 donors were fed with anti-DEC205 or control isotype antibody conjugated to Flu-M1 (aa 55–72) at the indicated doses for 4 h at 37°C. The cells were then washed and cultured with autologous CFSE-labeled CD8+ T cells in the presence of IL-2 and TLR7/8 L. 8–10 d later, Flu-M1–specific CD8+ T cell expansion was evaluated by gating on CFSElow cells positive for Flu-M1 (aa 58–66) pentamer. Shown is one representative experiment of n > 6. (B) As in A; anti-DEC205 and the control isotype antibodies were conjugated to CMV-pp65 (aa 488–508). Shown is one representative experiment of two. (C) Accumulation of anti-DEC205 antibody. Day 1 DCs were fed with Alexa Fluor 488–labeled anti-DEC205 antibody continuously for 4–6 h at 4 or 37°C. Results were analyzed by flow cytometry. 4°C MFI was subtracted from the 37°C MFI, and the resulting MFI was normalized to BDCA1+ DCs. Data shown are the mean MFI ± SD (n = 7 independent experiments). (D) Internalization of anti-DEC205 antibody. Day 1 DCs were incubated with Alexa Fluor 488–labeled anti-DEC205 antibody for 30 min at 4°C. The cells were then washed and cultured at 37°C for the indicated times. At each time point, cells were labeled with an Alexa Fluor 647–labeled anti–human IgG antibody to label remaining surface bound antibody. Cells were then analyzed by flow cytometry. The total DEC205 is Alexa Fluor 488–labeled antibody, whereas the surface DEC205 is the Alexa Fluor 647–labeled anti–human antibody. Shown is one representative experiment of four. (E) Anti-DEC205 antibody trafficking. Day 1 DCs were fed Alexa Fluor 488–labeled anti-DEC205 antibody (green) continuously for 3 h at 37°C, washed, and allowed to adhere to coverslips. After fixation and permeabilization, the lysosomes and cell membrane were stained using anti-Lamp1 (red) and anti–HLA-DR (blue) antibodies, respectively. Cells were then analyzed using confocal microscopy. Bars, 7.5 µm. Shown is one representative experiment of five. (F) Detection of the indicated lysosomal proteases by Western blot of day 1 BDCA1+ DCs, BDCA3+ DCs, and mo-DCs. DC subsets were lysed and analyzed by Western blot for lysosomal protease expression. Shown is one representative experiment of three.
Figure 4.
Figure 4.
Antigens escaping from lysosomes are cross presented equally by both DC subsets. (A) Number of IAV particles associated with DCs. Day 1 DCs were fed either with fusion-competent or -incompetent replication-defective (heat inactivated, HI) IAV for 6 h at 37°C. The cells were then washed and allowed to adhere to coverslips. After fixation and permeabilization, the cells were labeled with an anti-NP antibody. Cells were analyzed by confocal microscopy. Numbers of cells associated with IAV particles were counted and quantified. Shown is one representative experiment of three. (B) Cross presentation of fusion-competent and fusion-incompetent HI IAV. Day 1 DCs from HLA-A*0201 donors were fed with fusion-competent pH 7.4–treated HI IAV or fusion-incompetent pH 4.5–treated HI IAV for 6 h at 37°C. The cells were then washed and cultured with autologous CFSE-labeled CD8+ T cells. 8–10 d later, CD8+ T cell expansion was evaluated by gating on CFSElow cells positive for Flu-M1 (aa 58–66) pentamer. Shown is one representative experiment of three. (C) Cross presentation of escape-competent and escape-incompetent KBMA L. monocytogenes. Day 1 DCs from HLA-A*0201 donors were fed for 1 h with escape-incompetent (LLO) and escape-competent (LLO+) KBMA L. monocytogenes strains engineered to secrete ActAN100-Flu-M1 (aa 58–66) fusion protein. The cells were then washed and, as in B, cultured with autologous T cells to measure antigen cross presentation. Shown is one representative experiment of three.
Figure 5.
Figure 5.
Antigen targeted to early endosomes via CD40 is cross presented by both DC subsets with similar efficacy. (A) Anti-CD40 antibody intracellular trafficking. Day 1 BDCA1+ DCs (top) or BDCA3+ DCs (bottom) were fed with Alexa Fluor 488–labeled anti-CD40 antibody (green) continuously for 3 h at 37°C, washed, and allowed to adhere to coverslips. After fixation and permeabilization, the lysosomes or early endosomes were stained using anti-Lamp1 or anti-EEA1 (red), respectively. Plasma membrane was stained using anti–HLA-DR (blue) antibodies. Cells were then analyzed using confocal microscopy. Bars, 5 µm. Shown is one representative experiment of three. (B) Accumulation of anti-CD40 antibody. Day 1 DCs were fed with Alexa Fluor 488–labeled anti-CD40 antibody continuously for 4–6 h at 4°C or 37°C. Results were analyzed by flow cytometry. The 4°C MFI was subtracted from the 37°C MFI, and the resulting MFI was normalized to BDCA1+ DCs. Data shown are the mean MFI ± SD (n = 3 independent experiments). (C) Antigen cross presentation via CD40 in DC subsets. Day 1 isolated DCs from HLA-A*0201 donors were fed with anti-CD40, or control isotype antibody conjugated to Flu-M1 (aa 55–72) at 1 µg/ml for 4 h at 37°C. The cells were then washed and cultured with autologous CFSE-labeled CD8+ T cells in the presence of IL-2 and TLR7/8 L. 8–10 d later, Flu-M1–specific CD8+ T cell expansion was evaluated by gating on CFSElow cells positive for Flu-M1 (aa 58–66) pentamer. Shown is one representative experiment of more than five. (D) As in C; anti-CD40 and control isotype antibodies were conjugated to CMV-pp65 (aa 488–508) at the indicated doses. Shown is one representative experiment of two.
Figure 6.
Figure 6.
Antigen targeted to early endosomes via CD11c is cross presented by both DC subsets with similar efficacy. (A) Anti-CD11c antibody intracellular trafficking. Day 1 BDCA1+ DCs were fed with Alexa Fluor 488–labeled anti-CD11c antibody (green) continuously for 3 h, washed, and allowed to adhere to coverslips. After fixation and permeabilization, the early endosomes and plasma membrane were stained using EEA1 (red) and anti–HLA-DR (blue) antibodies, respectively. Cells were then analyzed using confocal microscopy. Bar, 5 µm. Shown is one representative experiment of three. (B) Antigen cross presentation via CD11c in DC subsets. Day 1 isolated DCs from HLA-A*0201 donors were fed with anti-CD11c or control isotype antibody conjugated to Flu-M1 (aa 55–72) at indicated doses for 4 h at 37°C. The cells were then washed and cultured with autologous CFSE-labeled CD8+ T cells in the presence of IL-2 and TLR7/8 L. 8–10 d later, CD8+ T cell expansion was evaluated by gating on CFSElow cells positive for Flu-M1 (aa 58–66) pentamer. Shown is one representative experiment of three.
Figure 7.
Figure 7.
Antigen delivered to early endosomes via CD40 is more efficiently cross presented by all DC subsets than antigen delivered to lysosomes via DEC205. (A) Antibody accumulation. Day 1 DCs were fed with Alexa Fluor 488–labeled anti-DEC205 or anti-CD40 antibody continuously for 3–4 h at 4°C or 37°C. Results were analyzed by flow cytometry. The 4°C MFI was subtracted from the 37°C MFI, and resultant MFI was normalized to BDCA1+ DCs fed with anti-DEC205. MFI was also normalized for the number of fluorophores per antibody. Data shown are the mean MFI ± SD (n = 5 independent experiments). (B and C) Antigen cross presentation via CD40 and DEC205 in DC subsets. Day 1 isolated DCs from HLA-A*0201 donors were fed with anti-DEC205, anti-CD40, or control isotype antibodies conjugated to Flu-M1 (aa 55–72) at indicated doses for 4 h at 37°C. The cells were then washed and cultured with autologous CFSE-labeled CD8+ T cells in the presence of IL-2 and TLR7/8 L. 8–10 d later, Flu-M1–specific CD8+ T cells were detected by staining with Flu-M1 (aa 58–66) pentamer. T cell proliferation was measured by CFSE dilution. The graphs shown in B show frequency of CFSElow, Flu-M1 (aa 58–66) pentamer-positive CD8+ T cells. In C, FACS plots of CD8+ T cells showing CFSE dilution in response to antigen presentation and numbers indicate frequency of CD8+ T cells in each quadrant. Shown is one representative experiment of three.
Figure 8.
Figure 8.
Antigen delivered to early endosomes is presented on MHCII equally by all DC subsets and is more efficiently presented than antigen delivered to lysosomes. Day 1 isolated DCs from HLA-DPB1*0401 donors were fed with anti-DEC205, anti-CD40, or control isotype antibodies conjugated to NY-ESO-1 (aa 154–180) for 1.5 h. Cells were then washed and cultured with an NY-ESO-1–specific CD4+ T cell clone at a ratio of DCs to T cells of 1/1. CD4+ T cells were then stained for intracellular cytokines. The percentage of CD4+ T cells positive for IFN-γ, IL-2, and TNF are depicted. Shown is one representative experiment of four.

References

    1. Accapezzato D., Visco V., Francavilla V., Molette C., Donato T., Paroli M., Mondelli M.U., Doria M., Torrisi M.R., Barnaba V. 2005. Chloroquine enhances human CD8+ T cell responses against soluble antigens in vivo. J. Exp. Med. 202:817–828 10.1084/jem.20051106 - DOI - PMC - PubMed
    1. Amigorena S., Savina A. 2010. Intracellular mechanisms of antigen cross presentation in dendritic cells. Curr. Opin. Immunol. 22:109–117 10.1016/j.coi.2010.01.022 - DOI - PubMed
    1. Bachem A., Güttler S., Hartung E., Ebstein F., Schaefer M., Tannert A., Salama A., Movassaghi K., Opitz C., Mages H.W., et al. 2010. Superior antigen cross-presentation and XCR1 expression define human CD11c+CD141+ cells as homologues of mouse CD8+ dendritic cells. J. Exp. Med. 207:1273–1281 10.1084/jem.20100348 - DOI - PMC - PubMed
    1. Banchereau J., Steinman R.M. 1998. Dendritic cells and the control of immunity. Nature. 392:245–252 10.1038/32588 - DOI - PubMed
    1. Belizaire R., Unanue E.R. 2009. Targeting proteins to distinct subcellular compartments reveals unique requirements for MHC class I and II presentation. Proc. Natl. Acad. Sci. USA. 106:17463–17468 10.1073/pnas.0908583106 - DOI - PMC - PubMed

MeSH terms