

doi: 10.5210/ojphi.v3i3.3798.
Epub 2011 Dec 22.
Probabilistic, Decision-theoretic Disease Surveillance and Control
Affiliations
- PMID: 23569617
- PMCID: PMC3615794
- DOI: 10.5210/ojphi.v3i3.3798
Item in Clipboard
Probabilistic, Decision-theoretic Disease Surveillance and Control
Online J Public Health Inform.
2011.
Abstract
The Pittsburgh Center of Excellence in Public Health Informatics has developed a probabilistic, decision-theoretic system for disease surveillance and control for use in Allegheny County, PA and later in Tarrant County, TX. This paper describes the software components of the system and its knowledge bases. The paper uses influenza surveillance to illustrate how the software components transform data collected by the healthcare system into population level analyses and decision analyses of potential outbreak-control measures.
Figures
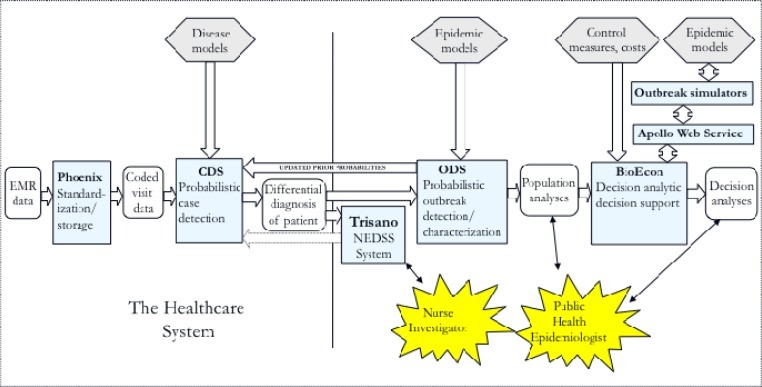
Information flow in the probabilistic, decision-theoretic disease surveillance system. Legend: light blue rectangles, software components: CDS, Case Detection System; ODS, Outbreak Detection and characterization System; hexagons, knowledge bases; rounded rectangles, data and analyses; thin arrows, user interfaces; large arrows indicate that the components exchange data electronically in the direction indicated; dotted arrow indicates a future connection sending case data collected by nurse investigators from Trisano® to CDS.
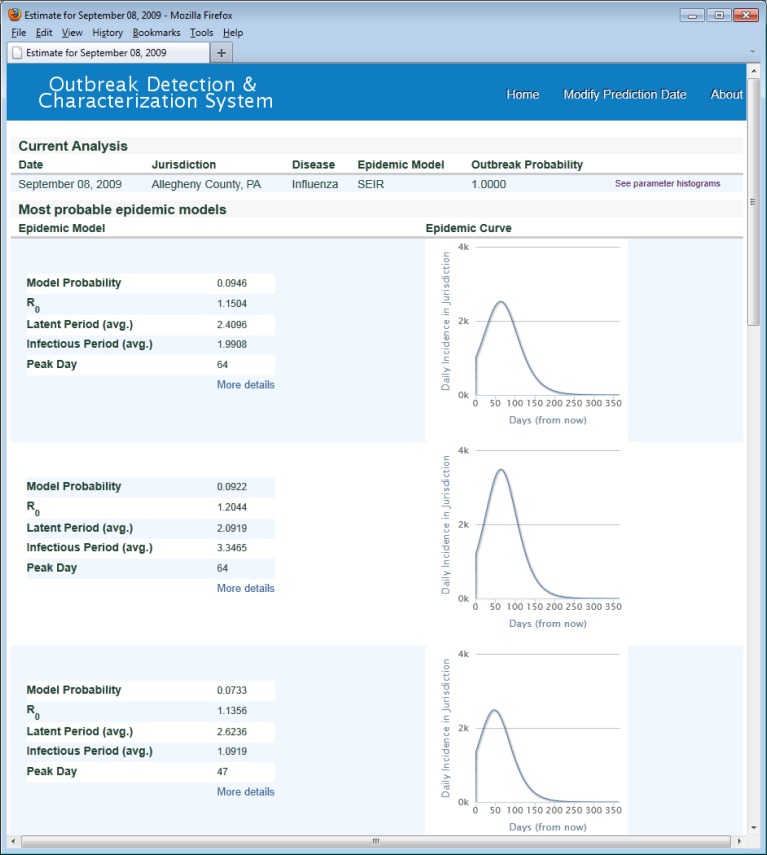
ODS, most probable models.
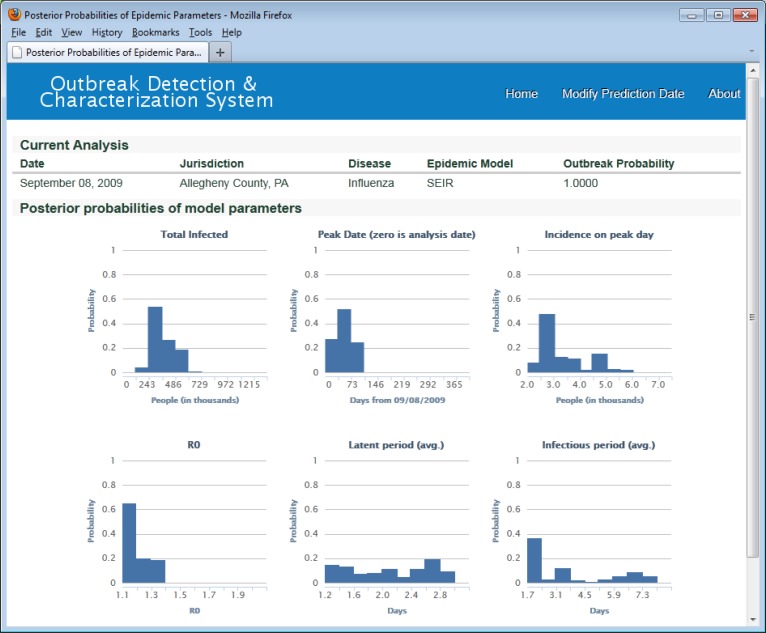
Distributions of total infected, peak date, incidence on peak day, and posterior distributions for Ro, latent period, and infectious period. ODS used uniform prior probabillity distributions for SEIR model parameters in this analysis. For example, the prior distribution for Ro was uniform over the range 1.1 to 1.9.
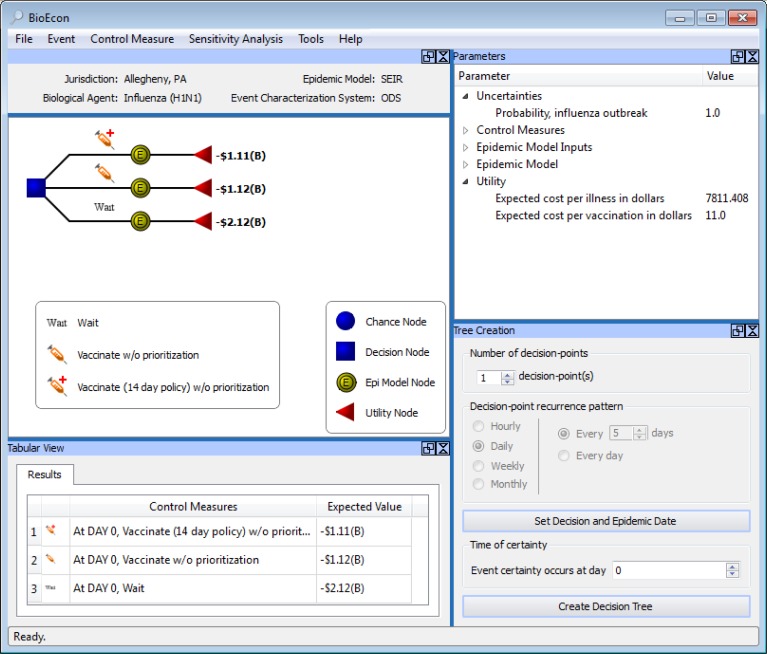
BioEcon.
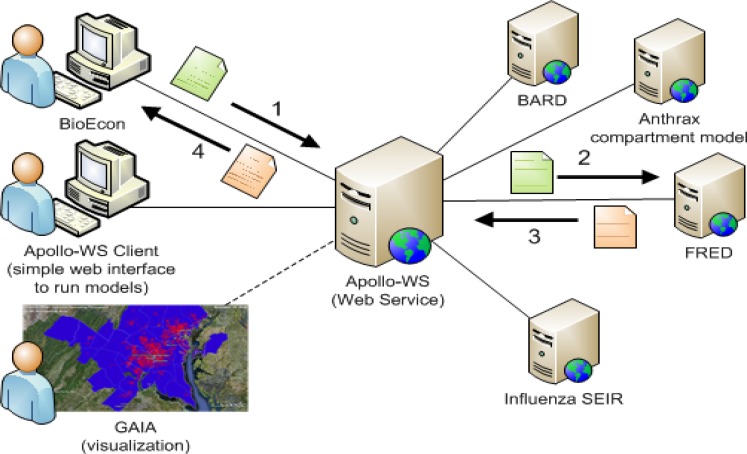
Apollo Web Service
References
-
- Harvey AC. The Kalman filter and its applications in econometrics and time series analysis. Methods of Operations Research. 1982;44(1):3–18.
-
- Le Strat Y, Carrat F. Monitoring epidemiologic surveillance data using hidden Markov models. Statistics in medicine. 1999;18(24):3463–78. - PubMed
Grants and funding
LinkOut - more resources
Full Text Sources
Other Literature Sources
