

Analysis of trabecular distribution of the proximal femur in patients with fragility fractures
- PMID: 23570243
- PMCID: PMC3674935
- DOI: 10.1186/1471-2474-14-130
Analysis of trabecular distribution of the proximal femur in patients with fragility fractures
Abstract
Background: Multi-detector computed tomography (MDCT) was used in order to assess the trabecular distribution of proximal femur and its relationship with hip fragility fractures.
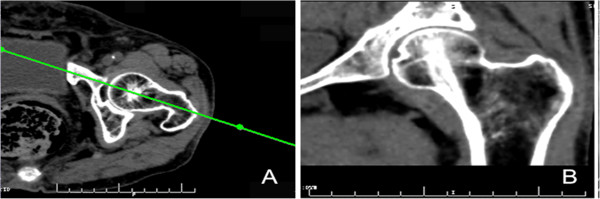
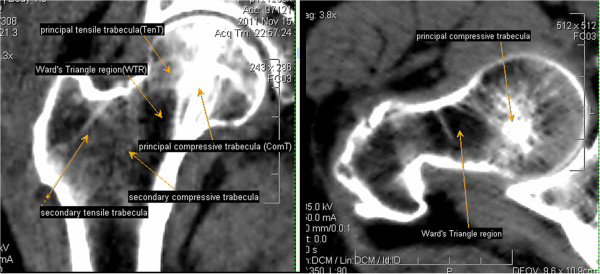
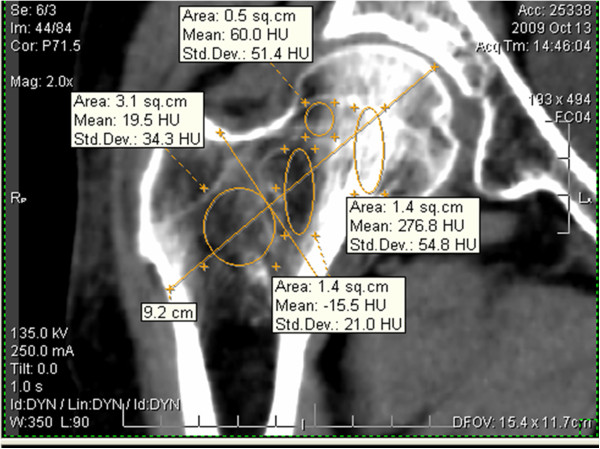
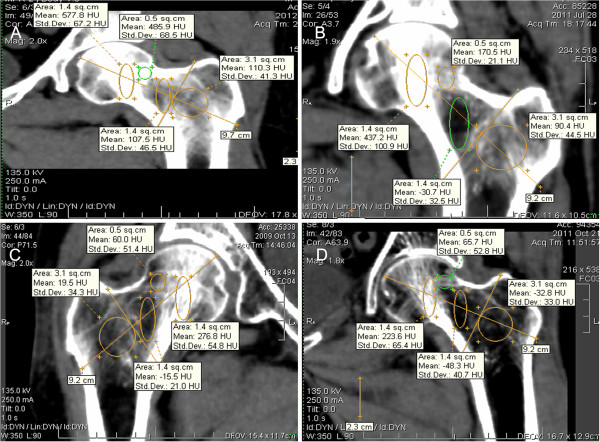
Methods: A total of 99 elderly women were scanned by MDCT including: 27 trochanteric hip fractures (group A), 40 femoral neck fractures (group B), and 32 non-fractures (group C). A mid-coronal MPR image of the proximal femur was reconstructed for every patient by e-Film95 software. Four regions of interest (ROI) were chosen in the images including compressive trabecula (ComT), tensile trabecula (TenT), trochanteric trabecula (TroT) and Ward's triangle (WT) region. The mean CT values were measured by the software.
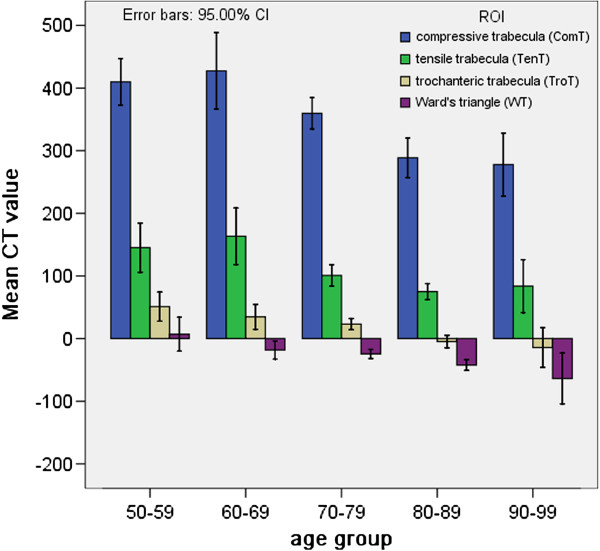
Results: The mean age was 81.44, 74.10 and 69.25 years for groups A, B and C, respectively. There was significant inter-group differences based on one-way ANOVA (P<0.05). The CT values in the four ROIs had significant differences in the groups except for TenT between group A and B (P>0.05). After the age adjustment with ANCOVA, the mean CT values of TroT and WT were significantly lower in group A as compared to that of the group B (P<0.05). However, there were no significant differences for ComT and TenT between groups A and B (P>0.05).
Conclusions: The occurrence of femoral neck fracture was closely related to the degeneration of ComT and TenT. Trochanteric hip fractures were associated with a more severe degeneration in TroT as well as an enlargement of WT region besides the ComT and TenT degeneration. We concluded that the hip fragility fractures might be predicted by the measurement of the mean CT values in ComT, TenT, TroT and WT region.
Figures
References
-
- Dragomir-Daescu D, Op DBJ, McEligot S, Dai Y, Entwistle RC, Salas C, Melton LR, Bennet KE, Khosla S, Amin S. Robust QCT/FEA models of proximal femur stiffness and fracture load during a sideways fall on the hip. Ann Biomed Eng. 2011;39(2):742–755. doi: 10.1007/s10439-010-0196-y. - DOI - PMC - PubMed
MeSH terms
LinkOut - more resources
Full Text Sources
Other Literature Sources
Medical
Miscellaneous
