. 2013 Apr 9;6(1):7.
doi: 10.1186/1756-8935-6-7.

Endogenous mammalian histone H3.3 exhibits chromatin-related functions during development

Affiliations

Endogenous mammalian histone H3.3 exhibits chromatin-related functions during development

Kelly M Bush et al. Epigenetics Chromatin. .

Abstract

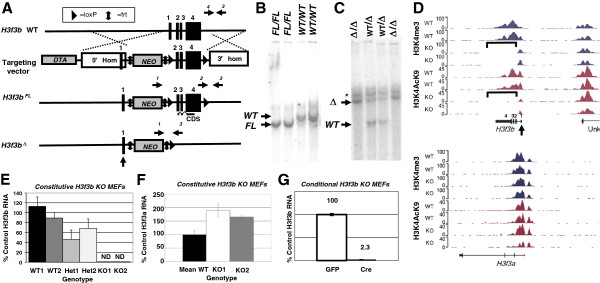
Background: The histone variant H3.3 plays key roles in regulating chromatin states and transcription. However, the role of endogenous H3.3 in mammalian cells and during development has been less thoroughly investigated. To address this gap, we report the production and phenotypic analysis of mice and cells with targeted disruption of the H3.3-encoding gene, H3f3b.

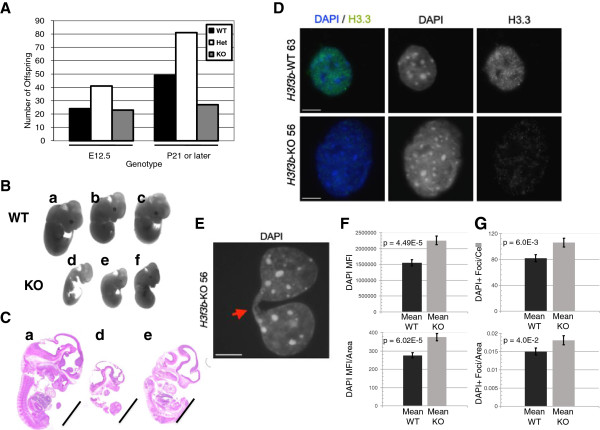
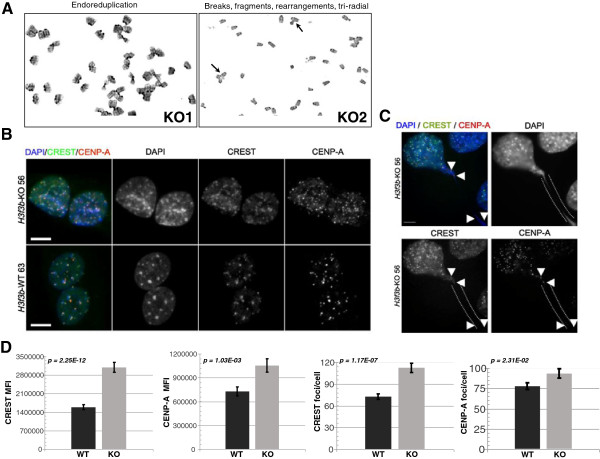
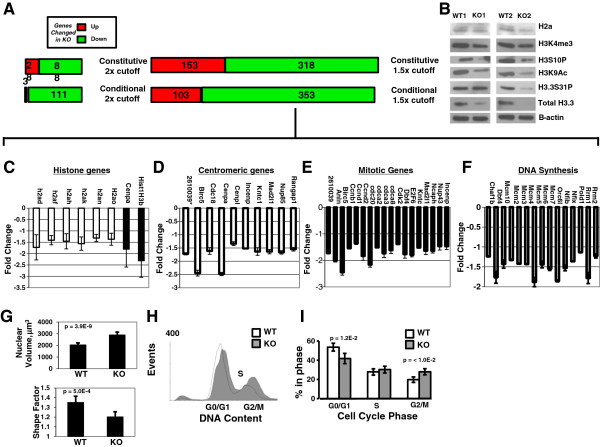
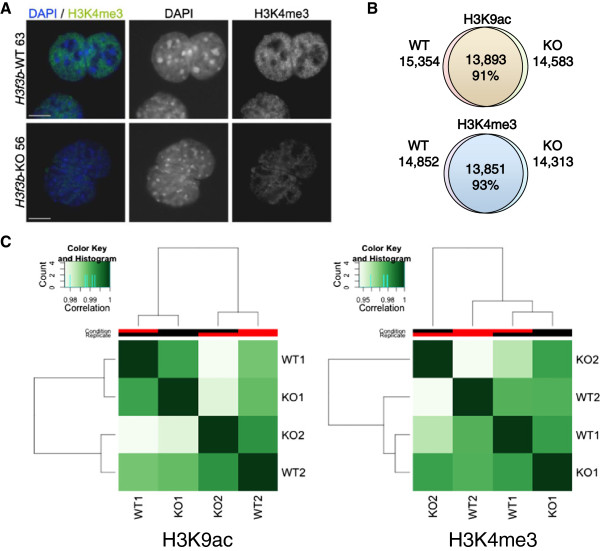
Results: H3f3b knockout (KO) mice exhibit a semilethal phenotype traceable at least in part to defective cell division and chromosome segregation. H3f3b KO cells have widespread ectopic CENP-A protein localization suggesting one possible mechanism for defective chromosome segregation. KO cells have abnormal karyotypes and cell cycle profiles as well. The transcriptome and euchromatin-related epigenome were moderately affected by loss of H3f3b in mouse embryonic fibroblasts (MEFs) with ontology most notably pointing to changes in chromatin regulatory and histone coding genes. Reduced numbers of H3f3b KO mice survive to maturity and almost all survivors from both sexes are infertile.

Conclusions: Taken together, our studies suggest that endogenous mammalian histone H3.3 has important roles in regulating chromatin and chromosome functions that in turn are important for cell division, genome integrity, and development.


Figures

Figure 1
Figure 1
Generation and validation of conditional, floxed and constitutive knockout (KO) alleles of theH3f3bgene. (A) (top) The wildtype (WT) H3f3b allele. (second row) The targeting vector contains loxP sites (triangles) that flank exons 2 to 4, a 4.3 kb 5’ arm of homology, a 5.3 kb 3’ arm of homology, diphtheria toxin A (DTA) cassette, and a neomycin (Neo) cassette flanked by frt sites (vertical double arrows). The Neo element allows for positive selection in embryonic stem (ES) cells, while the DTA element permits negative selection in ES cells. (third row) After homologous recombination of the conditional knockout construct, the H3f3b gene is expressed until Cre-mediated deletion of exons 2 to 4 (bottom), deleting the entire coding sequence (CDS). (B) Southern blotting of H3f3b WT and floxed mice using a 3’ probe yields the expected 20 kb and 17 kb bands, respectively validating appropriate gene targeting. (C) Southern blotting using a 5’ probe generates the predicted 20 and 10 kb bands for KO and WT alleles in the samples of the indicated genotypes. With this probe a background band (*) was present in all samples. (D) Mapped reads from ChIP-Seq assays on KO and WT mouse embryonic fibroblasts (MEFs) 1 and 2 for histone 3 lysine 4 tri-methylation (H3K4me3) and histone 3 lysine 9 acetylation (H3K9ac) indicate precise deletion of the H3f3b floxed region with undeleted Exon 1 still exhibiting histone marks. (E, F) qPCR of H3f3b (E) and H3f3a (F) mRNA levels in MEFs of indicated genotypes. (G) qPCR assay of H3f3b mRNA levels in conditional KO MEFs. Error bars are standard deviations. ND = none detected.
Figure 2
Figure 2
Loss ofH3f3bcauses a semilethal phenotype and in a subset of embryos strongly impairs overall growth. (A) Ratios of animals of the indicated ages from heterozygous intercrosses indicate substantial lethality among mature knockout (KO) animals.* 0.01 < P <0.05 by Chi Square. (B, C) KO E12.5 embryos exhibit strong reductions in overall growth. Scale bar = 1 mm. (D) Wildtype (WT) 63 and KO 56 E12.5 mouse embryonic fibroblasts (MEFs) stained with anti-H3.3 antibodies show higher levels of H3.3 in WT MEFs. (E) Chromosomal bridges were observed much more frequently in KO nuclei than in WT nuclei. DAPI staining of a KO 56 nuclei shows representative example of a KO chromosomal bridge. (F) H3f3b KO MEFs exhibit a statistically significant 1.45 to 1.5-fold increase in DAPI mean fluorescence intensity (MFI) per nuclei, and a 1.21 to 1.36-fold increase in the amount of DAPI MFI per unit of nuclear area. (G) H3f3b KO MEFs display a significant 1.30 to 1.5-fold increase in the number of pericentric heterochromatic DAPI foci per nuclei, and a significant increase in the number of DAPI-positive foci per unit of nuclear area. Scale bars = 10 um.
Figure 3
Figure 3
H3f3bknockout(KO) mouse embryonic fibroblasts (MEFs) exhibit chromosomal bridges, severe karyotypic abnormalities, and ectopic staining of CENP-A and CREST. (A) Karyotyping revealed a number of types of abnormalities in H3f3b KO MEFs not observed in wildtype (WT) MEFs including endoreduplication, chromosomal fragmentation, and tri-radial chromosomes (See also Additional file 3: Figure S3 and Table 1). (B) Staining of WT 63 and KO 56 cells with CREST and CENP-A antisera (green and red in merge, respectively). (C) KO MEFs with chromosomal bridges had higher levels of CREST and CENPA foci (white arrows). (D) Quantification of foci staining for KO 49 and 52 versus WT 46 and 48. An average of 17 confocal sections per nuclei were analyzed using ImageJ software as in this study [43]. Scale bars = 10 um.
Figure 4
Figure 4
The ontology of transcriptome changes with loss ofH3f3bindicates changes in histone, centromere, mitotic, and DNA synthesis genes. (A) RNA isolated from control and H3f3b knockout (KO) mouse embryonic fibroblasts (MEFS) (wildtype (WT)1,2 versus KO 1,2) was used for expression microarray studies. Gene expression changes are reported as green and red bars for down and upregulated genes respectively based on the indicated cutoffs for fold changes. (B) Immunoblot for H3.3 protein demonstrating strong reductions in total H3.3 and changes in other histone mark protein levels in the two KO MEF lines used for array and ChIP-Seq studies. (C) Average gene expression levels of downregulated histones consistent between conditional and constitutive array. (D) An ontological cluster of downregulated centromeric genes was evident consistently in H3f3b KO MEFs. (E) Data from arrays on WT and KO MEFs indicated a very large ontological cluster of mitotic regulatory genes is downregulated in the absence of H3f3b. (F) DNA synthesis genes downregulated as measured by microarray. (G) KO1 MEFs had significantly larger and rounder nuclei compared to littermate MEF WT1. (H) Cell cycle analysis by flow cytometry for DNA content on WT MEFs 46 and 48 versus KO MEFs 49 and 52 revealed, when quantitated, as shown in (I) a 40% increase in G2/M phase in KO cells. Error bars in (B-E, G, I) are standard deviations. *2610039 is an abbreviation for the 2610039C10Rik gene whose protein product has a mitotic ontology.
Figure 5
Figure 5
Global changes in genomic levels of H3K9ac and H3K4me3 with loss ofH3f3bsuggest a moderate role for H3.3 in euchromatin. (A) Immunostaining in wildtype (WT) 63 versus knockout (KO) 56 indicates a modest decrease in global histone 3 lysine 4 tri-methylation (H3K4me3) levels in KO nuclei. Scale bar = 10 um. (B) ChIP-seq analysis of H3K4me3 and histone 3 lysine 9 acetylation (H3K9ac) marks was performed, normalizing samples to input for peak calling. Venn diagrams show the number of total and overlapping peaks in WT and KO samples. Note, that for each condition the data presented are total peak numbers from merged biological duplicates of WT1 and WT2 versus KO1 and KO2. The number and percentage of overlapping peaks are indicated in the middle of each diagram. (C) Binding affinity clustering heatmap of H3K9ac (left) and H3K4me3 (right) peaks in two biological replicates of WT and KO MEFs. Correlation color codes are shown above each plot. Clustering was performed using R package DiffBind, which clusters the samples based on the normalized read counts for each sample at each putative histone mark peak.

References

    1. McKittrick E, Gafken PR, Ahmad K, Henikoff S. Histone H3.3 is enriched in covalent modifications associated with active chromatin. Proc Natl Acad Sci USA. 2004;101:1525–1530. - PMC - PubMed
    1. Schwartz BE, Ahmad K. Transcriptional activation triggers deposition and removal of the histone variant H3.3. Genes Dev. 2005;19:804–814. - PMC - PubMed
    1. Goldberg AD, Banaszynski LA, Noh KM, Lewis PW, Elsaesser SJ, Stadler S, Dewell S, Law M, Guo X, Li X, Wen D, Chapgier A, DeKelver RC, Miller JC, Lee YL, Boydston EA, Holmes MC, Gregory PD, Greally JM, Rafii S, Yang C, Scambler PJ, Garrick D, Gibbons RJ, Higgs DR, Cristea IM, Urnov FD, Zheng D, Allis CD. Distinct factors control histone variant H3.3 localization at specific genomic regions. Cell. 2010;140:678–691. - PMC - PubMed
    1. Delbarre E, Jacobsen BM, Reiner AH, Sorensen AL, Kuntziger T, Collas P. Chromatin environment of histone variant H3.3 revealed by quantitative imaging and genome-scale chromatin and DNA immunoprecipitation. Mol Biol Cell. 2010;21:1872–1884. - PMC - PubMed
    1. Jin C, Zang C, Wei G, Cui K, Peng W, Zhao K, Felsenfeld G. H3.3/H2A.Z double variant-containing nucleosomes mark 'nucleosome-free regions' of active promoters and other regulatory regions. Nat Genet. 2009;41:941–945. - PMC - PubMed