. 2013 Jul;23(7):1130-41.
doi: 10.1101/gr.155127.113. Epub 2013 Apr 9.

Maps of open chromatin highlight cell type-restricted patterns of regulatory sequence variation at hematological trait loci

Collaborators, Affiliations

Maps of open chromatin highlight cell type-restricted patterns of regulatory sequence variation at hematological trait loci

Dirk S Paul et al. Genome Res. 2013 Jul.

Abstract

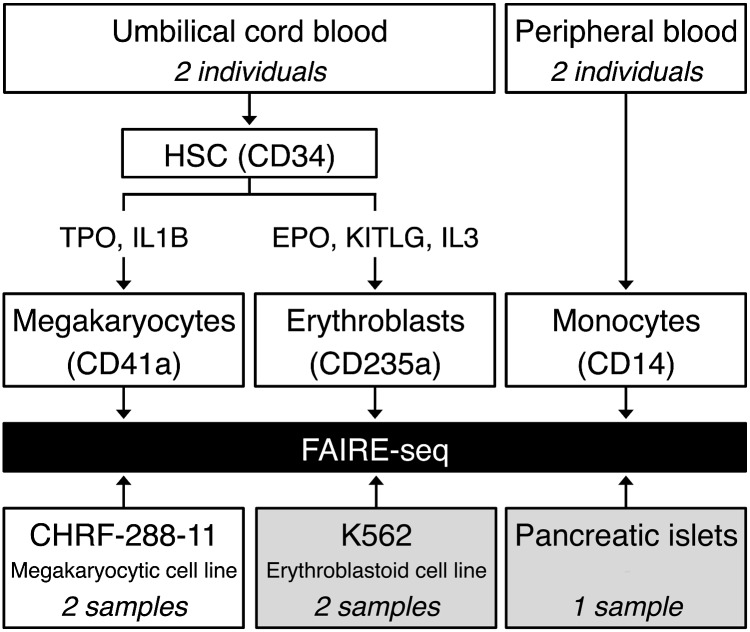
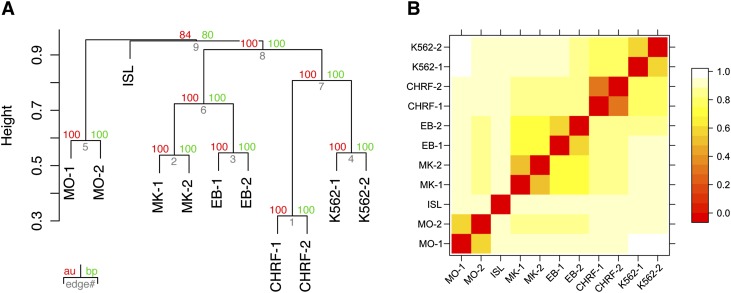
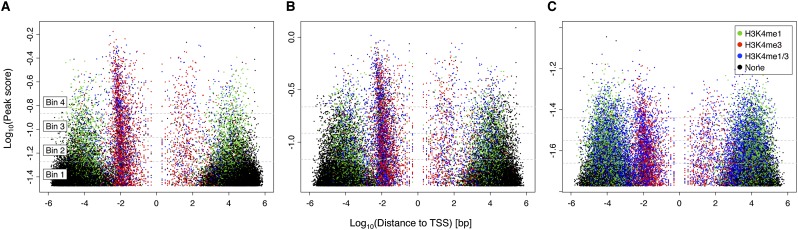
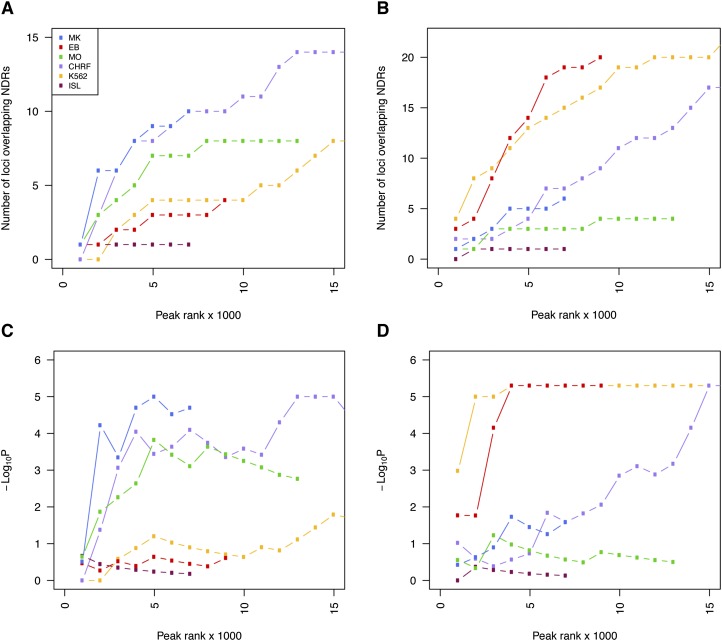
Nearly three-quarters of the 143 genetic signals associated with platelet and erythrocyte phenotypes identified by meta-analyses of genome-wide association (GWA) studies are located at non-protein-coding regions. Here, we assessed the role of candidate regulatory variants associated with cell type-restricted, closely related hematological quantitative traits in biologically relevant hematopoietic cell types. We used formaldehyde-assisted isolation of regulatory elements followed by next-generation sequencing (FAIRE-seq) to map regions of open chromatin in three primary human blood cells of the myeloid lineage. In the precursors of platelets and erythrocytes, as well as in monocytes, we found that open chromatin signatures reflect the corresponding hematopoietic lineages of the studied cell types and associate with the cell type-specific gene expression patterns. Dependent on their signal strength, open chromatin regions showed correlation with promoter and enhancer histone marks, distance to the transcription start site, and ontology classes of nearby genes. Cell type-restricted regions of open chromatin were enriched in sequence variants associated with hematological indices. The majority (63.6%) of such candidate functional variants at platelet quantitative trait loci (QTLs) coincided with binding sites of five transcription factors key in regulating megakaryopoiesis. We experimentally tested 13 candidate regulatory variants at 10 platelet QTLs and found that 10 (76.9%) affected protein binding, suggesting that this is a frequent mechanism by which regulatory variants influence quantitative trait levels. Our findings demonstrate that combining large-scale GWA data with open chromatin profiles of relevant cell types can be a powerful means of dissecting the genetic architecture of closely related quantitative traits.


Figures

Figure 1.
Figure 1.
Overview of the study design. Cord blood–derived CD34+ hematopoietic progenitor cells from two unrelated individuals were differentiated in vitro into either megakaryocytes (MKs) or erythroblasts (EBs). Monocytes (MOs) were purified from peripheral blood from another two individuals. We also prepared FAIRE samples from CHRF-288-11 megakaryocytic cells. In addition, we retrieved publicly available FAIRE-seq data sets for K562 erythroblastoid cells and pancreatic islets from The ENCODE Project Consortium (2012) and Gaulton et al. (2010), respectively, and reanalyzed the data sets in concordance with all other FAIRE data sets. (HSC) Hematopoietic stem cell; (TPO) thrombopoietin; (IL1B) interleukin 1, beta; (EPO) erythropoietin; (KITLG) KIT ligand (also known as SCF, or stem cell factor); (IL3) interleukin-3.
Figure 2.
Figure 2.
Hierarchical clustering of the overlap of FAIRE-derived nucleosome-depleted regions (NDRs). (A) The hierarchical clustering is based on the overlap of NDRs across different cell types, as shown in Supplemental Figure 2. The dendrogram shows that the clustering is dominated by cell type identity rather than individual preparation. The observed hierarchical tree mirrors the hematopoietic tree, where MKs and EBs share a common progenitor. MKs and EBs do not co-cluster with their representative cell lines, i.e., CHRF-288-11 and K562, respectively, indicating that the open chromatin structure of immortalized lines does not fully reflect that of primary cells. Both MOs and pancreatic islets form out-groups, due to the limited overlap of NDRs with the other cell types tested. This suggests that MOs, despite being one of the myeloid types of cells akin to MKs and EBs, have a marked different open chromatin profile. The hierarchical cluster analysis was performed using the R package Pvclust (distance: binary; cluster method: complete) (Suzuki and Shimodaira 2006). The uncertainty of the clustering was assessed using bootstrap resampling. (B) The heatmap of the binary distances complements the cluster plot. Relationships between NDRs across all samples are observable. The binary distances were plotted using the levelplot function of the R package lattice (http://cran.r-project.org/web/packages/lattice/). (MO) Monocyte; (MK) megakaryocyte; (EB) erythroblast; (ISL) pancreatic islet; (CHRF) CHRF-228-11 megakaryocytic cell; (K562) K562 erythroblastoid cell; (au) approximately unbiased P-value; (bp) bootstrap probability value.
Figure 3.
Figure 3.
Overlap of H3K4me3 (promoter) and H3K4me1 (enhancer) histone marks with NDRs. In (A) MKs and (B) EBs, NDRs in the highest intensity bin (Bin 4) showed stronger overlap with gene promoters close to TSSs compared with NDRs in the lowest retained intensity bin (Bin 2), which showed stronger overlap with enhancer elements distal to the closest TSS. NDRs that did not overlap with histone marks were more likely to be in the lowest intensity bin and far from promoters. (C) In MOs, however, we found that NDRs in the highest intensity bin were depleted close to the TSS compared with MKs and EBs. The peak bins are indicated with a dashed gray line. These results suggest that NDRs of different signal strength may have different functional properties.
Figure 4.
Figure 4.
Cell type–dependent enrichment of GWA signals associated with hematological quantitative traits at NDRs. (A,B) Cumulative number of GWA loci harboring platelet (A) and erythrocyte (B) trait-associated SNPs at NDRs across different cell types as a function of rank tranches for decreasing NDR signal strength (F-Seq peak score). (C,D) To determine whether such overlap was expected by chance, we compared the number of overlapping SNPs with 100,000 random samples of 68 and 75 SNPs at the platelet (C) and erythrocyte (D) QTLs, respectively. These random sets of SNPs were matched for possible confounding factors such as minor allele frequency, distance to a TSS, and number of proxy SNPs per locus. The achieved significance level is displayed across the cumulative rank tranches to better appreciate the effect of increasing the number of NDRs in the analysis. The strongest enrichment of genome-wide significant sequence variants at platelet and erythrocyte QTLs was found at NDRs in MKs and EBs, respectively. However, the enrichment was equally clear at NDRs in the respective immortalized lines, i.e., CHRF-288-11 megakaryocytic cells and K562 erythroblastoid cells, respectively. NDRs identified in CHRF-288-11 cells but not MKs were enriched for SNPs associated with erythrocyte indices, indicative of the less differentiated state of cell lines of leukemic origin relative to the primary cells.
Figure 5.
Figure 5.
Cell type distribution of NDRs containing candidate functional variants. We considered GWA index SNPs associated with platelet (A) and erythrocyte (B) parameters, as well as their proxy SNPs in high LD (r2 > 0.8; located within 1 Mb of index SNPs). NDRs were ranked by signal strength (F-Seq peak score). Then, these rankings were used to divide the NDRs into cumulative tranches (x-axis) to investigate the impact of peak calling thresholds on results. For example, the first bar represents the tranche containing the 1000 top-ranked NDRs, whereas the penultimate bar represents the tranche containing the 10,000 top-ranked NDRs of each cell type. The bars summarize the cell type distribution of candidate functional SNPs at NDRs as a percentage of the tranche-specific total. The last bar, labeled “Bkg,” represents the expected cell type distribution for the SNPs under the null hypothesis. The solid line indicates the number of SNPs overlapping the tranche-specific NDRs. The results showed that for both platelet and erythrocyte QTLs, the candidate functional variants were most commonly found at MK- and EB-restricted NDRs, respectively. This was true across the spectrum of peak calling thresholds.
Figure 6.
Figure 6.
Enrichment patterns of quantitative trait-associated variants with small effect sizes at cell type–restricted NDRs. The data points shown as circles and rectangles represent the deviation of the P-value distribution of SNPs at NDRs restricted to MKs, EBs, MOs, or pancreatic islets (ISLs) from the P-value distribution of matched randomly sampled SNPs at the 0.005 quantile (Supplemental Fig. 8). Thus, this deviation measures the level of enrichment of associated sequence variants at NDRs, where the circle and rectangle surface areas represent level of enrichment (mean ratios > 1) and depletion (mean ratios < 1), respectively. Gray symbols represent ratios that are not significantly different from 1; i.e., the mean ratio across replicates was within 2 SDs of 1. The level of enrichment is indicated for sequence variants associated with two platelet traits ([PLT] platelet count; [MPV] mean platelet volume), six erythrocyte indices ([Hb] total hemoglobin concentration; [PCV] packed red cell volume; [RBC] red blood cell count; [MCHC] mean red cell hemoglobin concentration; [MCH] mean red cell hemoglobin; [MCV] mean red cell volume), as well as four nonhematological quantitative traits ([FG] fasting glucose; [FI] fasting insulin; [BMI] body mass index; height). The circle area labeled “Power” gives a quantification of the amount of signal present in each GWA data set. Specifically, it represents the deviation of the P-value distribution of all tested SNPs from the expectation under the null at the 0.005 quantile.

Similar articles

Cited by

References

    1. The 1000 Genomes Project Consortium. 2010. A map of human genome variation from population-scale sequencing. Nature 467: 1061–1073 - PMC - PubMed
    1. Adams D, Altucci L, Antonarakis SE, Ballesteros J, Beck S, Bird A, Bock C, Boehm B, Campo E, Caricasole A, et al. 2012. BLUEPRINT to decode the epigenetic signature written in blood. Nat Biotechnol 30: 224–226 - PubMed
    1. Bernstein BE, Stamatoyannopoulos JA, Costello JF, Ren B, Milosavljevic A, Meissner A, Kellis M, Marra MA, Beaudet AL, Ecker JR, et al. 2010. The NIH Roadmap Epigenomics Mapping Consortium. Nat Biotechnol 28: 1045–1048 - PMC - PubMed
    1. Boyle AP, Guinney J, Crawford GE, Furey TS 2008. F-Seq: A feature density estimator for high-throughput sequence tags. Bioinformatics 24: 2537–2538 - PMC - PubMed
    1. Boyle AP, Hong EL, Hariharan M, Cheng Y, Schaub MA, Kasowski M, Karczewski KJ, Park J, Hitz BC, Weng S, et al. 2012. Annotation of functional variation in personal genomes using RegulomeDB. Genome Res 22: 1790–1797 - PMC - PubMed

Publication types

MeSH terms

Associated data