. 2013 Jul;33(7):1104-14.
doi: 10.1038/jcbfm.2013.56. Epub 2013 Apr 10.

Early inhibition of MMP activity in ischemic rat brain promotes expression of tight junction proteins and angiogenesis during recovery

Affiliations

Early inhibition of MMP activity in ischemic rat brain promotes expression of tight junction proteins and angiogenesis during recovery

Yi Yang et al. J Cereb Blood Flow Metab. 2013 Jul.

Abstract

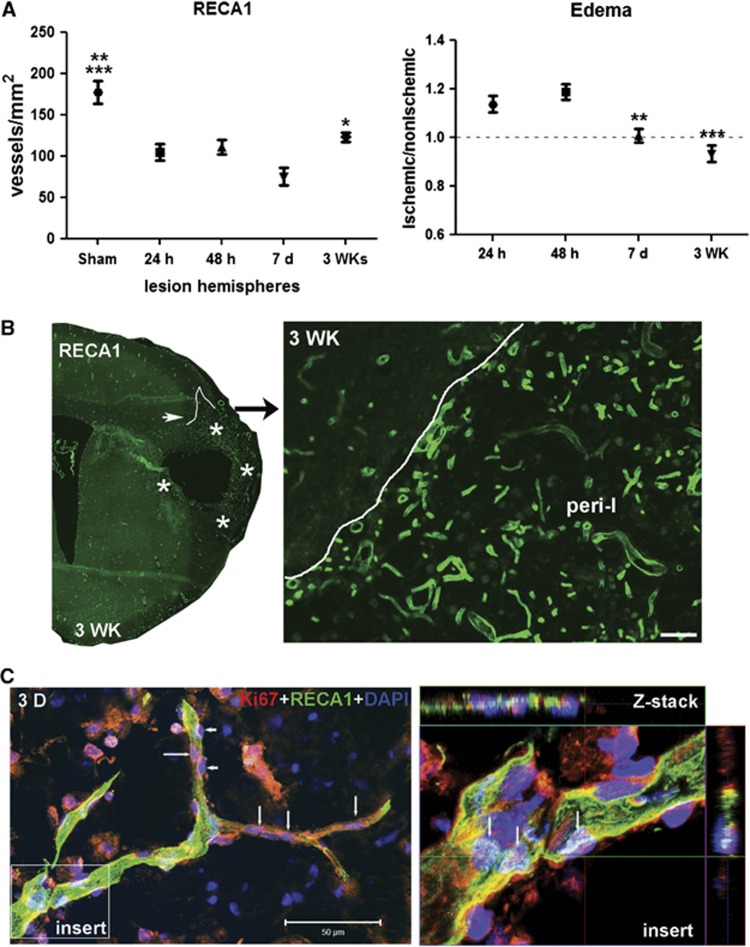
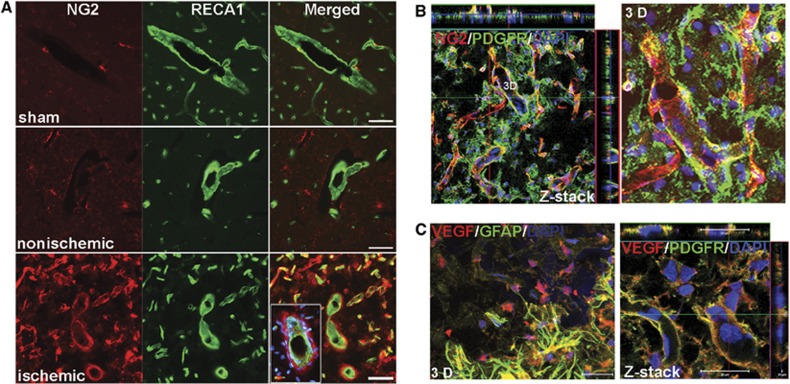
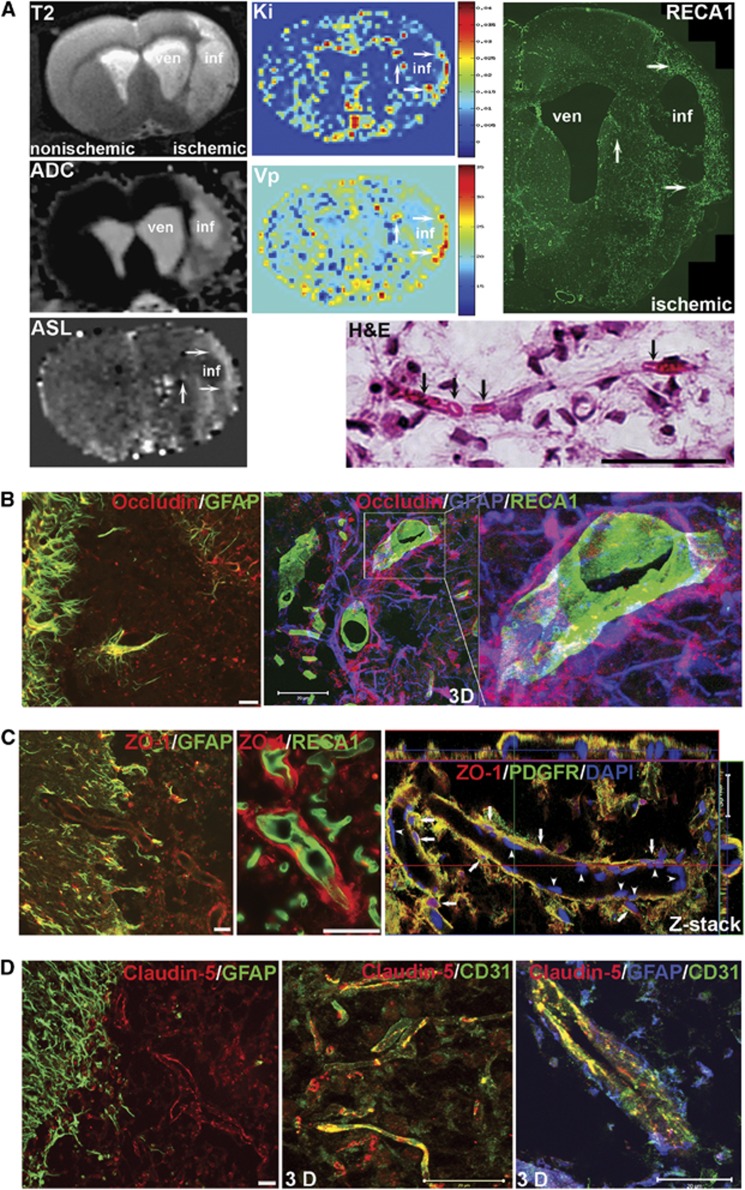
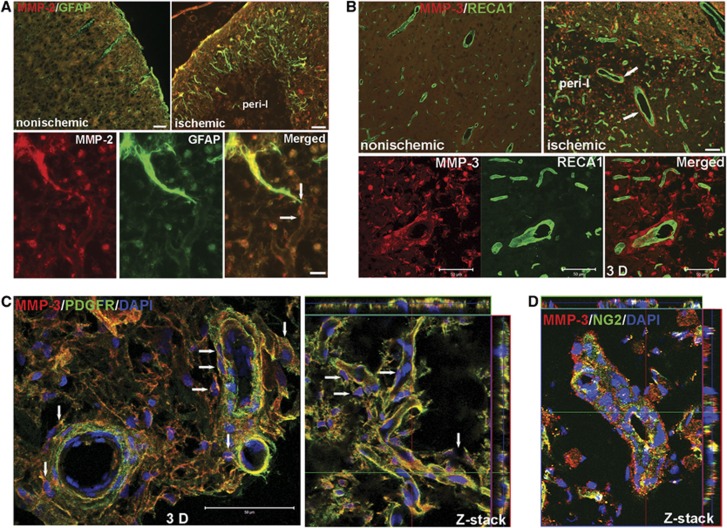
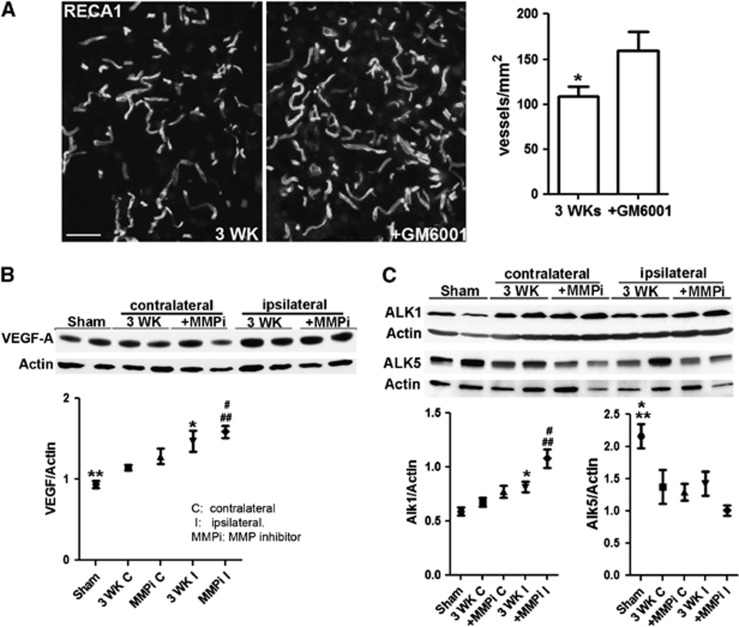
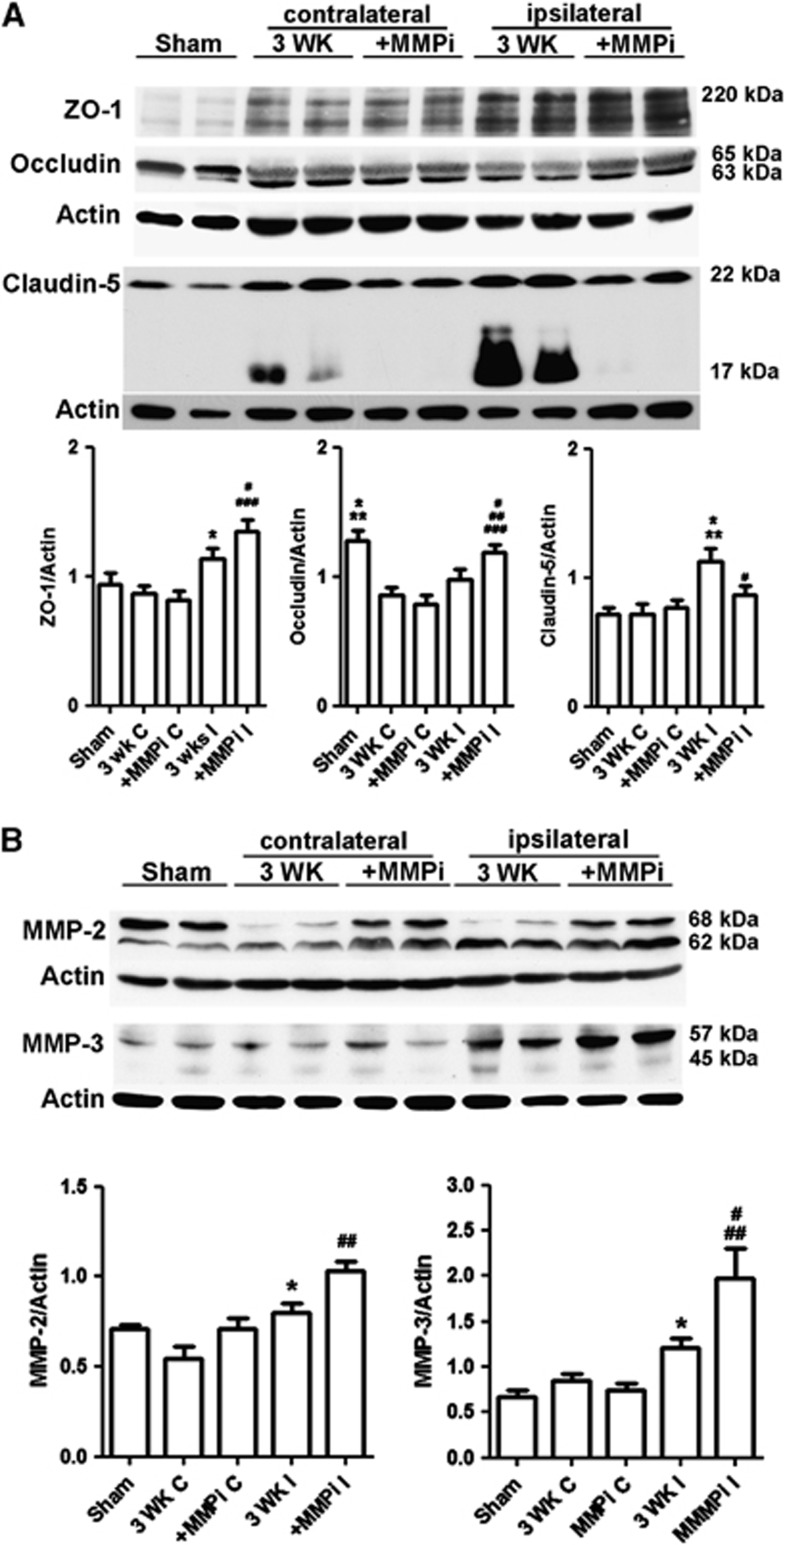
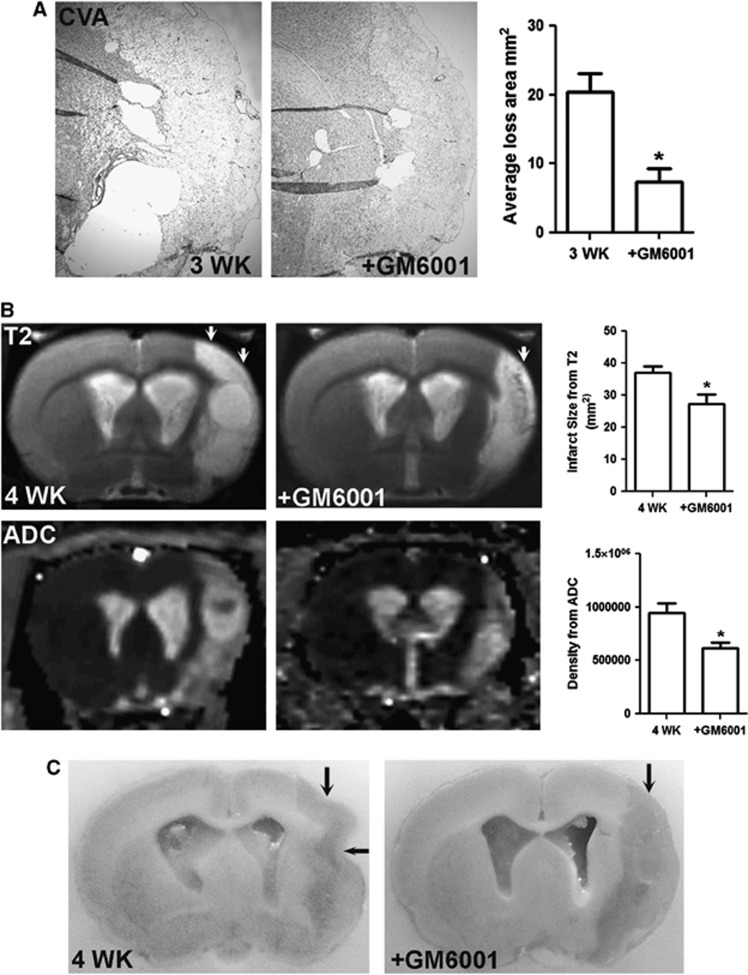
In cerebral ischemia, matrix metalloproteinases (MMPs) have a dual role by acutely disrupting tight junction proteins (TJPs) in the blood-brain barrier (BBB) and chronically promoting angiogenesis. Since TJP remodeling of the neurovascular unit (NVU) is important in recovery and early inhibition of MMPs is neuroprotective, we hypothesized that short-term MMP inhibition would reduce infarct size and promote angiogenesis after ischemia. Adult spontaneously hypertensive rats had a transient middle cerebral artery occlusion with reperfusion. At the onset of ischemia, they received a single dose of the MMP inhibitor, GM6001. They were studied at multiple times up to 4 weeks with immunohistochemistry, biochemistry, and magnetic resonance imaging (MRI). We observed newly formed vessels in peri-infarct regions at 3 weeks after reperfusion. Dynamic contrast-enhanced MRI showed BBB opening in new vessels. Along with the new vessels, pericytes expressed zonula occludens-1 (ZO-1) and MMP-3, astrocytes expressed ZO-1, occludin, and MMP-2, while endothelial cells expressed claudin-5. The GM6001, which reduced tissue loss at 3 to 4 weeks, significantly increased new vessel formation with expression of TJPs and MMPs. Our results show that pericytes and astrocytes act spatiotemporally, contributing to extraendothelial TJP formation, and that MMPs are involved in BBB restoration during recovery. Early MMP inhibition benefits neurovascular remodeling after stroke.


Figures

Figure 1
Figure 1
Increased number of newly formed vessels in ischemic hemispheres at 3 weeks of reperfusion. (A) Graph showing number of RECA1 staining microvessels in sham-operated and ischemic hemispheres. Focal ischemic stroke with reperfusion injury resulted in loss of RECA1-positive microvessels in ischemic hemispheres at 24 and 48 hours and 7 days. At 3 weeks after stroke, the number of RECA1-positive microvessels was increased compared with that at 7 days. *P<0.05 vs. 7 days, **P<0.01 vs. 48 hours and 3WK; ***P<0.001 vs. 24 hours and 7 days, n=6 per group. The edema in ischemic hemispheres at 24 hours, 48 hours, 7 days, and 3 weeks of reperfusion compared with nonischemic hemispheres expressed as edema index. **P<0.01, ***P<0.001 vs. 24 and 48 hours, respectively, n=6 per group. The number of vessels was normalized for edema. (B) Immunohistochemistry of RECA1, a marker of endothelial cells, represents microvessels in peri-infarct area in ischemic hemisphere with reperfusion of 3 weeks (3WK). Lines outline the border of lesion areas. Stars indicate the peri-infarct area. Right panel shows the peri-infarct (peri-I) area in higher magnification. A higher density of microvessels was seen in the peri-infarct area. Scale bar=50 μm. (C) Three-dimensional (3D) confocal microscopy shows that RECA1-positive vessel (green) contains nuclei expressing Ki67 (red, arrows), a marker of cell proliferation, in peri-infarct area at 3 weeks after stroke. Arrowheads show pericyte-like cells expressing Ki67. 4′-6-diamidino-2-phenylinidole (DAPI) (blue) was used to stain nuclei. Z-stack confocal micrograph (insert) shows colocalization of Ki67 with DAPI in vascular endothelial cells (arrows). Scale bar=50 μm.
Figure 2
Figure 2
Angiogenesis is associated with proliferating vascular pericytes in peri-infarct area at 3 weeks of reperfusion. (A) Micrographs show double-labeled NG2 and RECA1 in sham-operated, nonischemic, and ischemic hemispheres. NG2 antibody was used to identify immature pericytes, which indicate newly formed vessels. Increased immunostaining of NG2 was seen in the peri-infarct region, which specifically stained only the pericyte layer that was tightly apposed to the RECA1-positive microvessels. The insert represents a vessel cut transversely with NG2-positive pericytes surrounding it. 4′-6-diamidino-2-phenylinidole (DAPI) (blue) was used to stain nuclei. Scale bars=50 μm. (B) Z-stack and three-dimensional (3D) confocal micrographs show colocalization of NG2 (red) with PDGFR-β (PDGFR, green, a marker of pericytes) in vascular structures in peri-infarct region. In the Z-stack image, the inner layer of the vascular structures labeled with DAPI, indicating endothelial cells show no colocalization with NG2 and PDGFR-β. (C) Double immunostaining of VEGF-A (red) with GFAP (green) and PDGFR-β (green). 3D micrograph shows increased VEGF-A colocalized with astrocytes (GFAP) around the peri-infarct region. Within the peri-infarct region, Z-stack confocal micrograph indicates the vascular pericytes (PDGFR) expressing VEGF-A. DAPI was used to stain nuclei. Scale bars=20 or 50 μm.
Figure 3
Figure 3
Blood flow, blood–brain barrier (BBB) permeability, and expression of tight junction proteins (TJPs) in the new vessels within peri-infarct regions 3 weeks of reperfusion. (A) Hyperintensive areas in the anatomic T2 image and apparent diffusion coefficient (ADC) map show the lesion extent and tissue ischemia. ven: Ventricle; inf: Core infarct area. Color-coded permeability coefficient maps reconstructed from dynamic contrast-enhanced magnetic resonance imaging (MRI) data show the regions of high (red) and low (blue) permeability. Parametric image Ki map represents BBB transfer rate. Parametric image Vp map represents plasma volume. Elevated values of Ki and Vp are located in the vicinity of core infarct area (arrows). There are no signals of Ki and Vp in core infarct area. The color scales used for the permeability and plasma volume signal intensity. Arterial spin labeling (ASL) map shows higher cerebral blood flow (CBF) in peri-infarct areas (arrows). RECA1 immunostaining shows increased density of new vessels in peri-infarct area (arrows), corresponding to the elevated BBB transfer rate, plasma volume and blood perfusion (arrows). Hematoxylin and Eosin (H&E) staining shows red blood cells located inside of the new microvessels (arrows). (B) Left panel: double immunostaining of occludin (red) with astrocytes (GFAP, green) shows that occludin was colocalized with reactive astrocytes adjacent to or within the peri-infarct region. Middle and right panels: triple immunostaining of occludin (red) with astrocytes (blue) and endothelial cells (green). The 3D confocal images show that astrocytes expressing occludin (shown in purple when colocalized) with end-feet closely surrounding vessels. (C) Double immunostaining of zonula occludens-1 (ZO-1) with astrocytes, endothelial cells, and pericytes (PDGFR), respectively. ZO-1 colocalized with reactive astrocytes (GFAP) but not with endothelial cells (RECA1). Z-stack confocal image shows pericytes (green) surrounding vessels express ZO-1 (arrows). Arrowheads indicate 4′-6-diamidino-2-phenylinidole (DAPI)-stained endothelium. (D) Double immunostaining shows no colocalization (left panel) between astrocytes (green) and claudin-5 (red). The 3D confocal image (middle panel) shows that claudin-5 was colocalized with endothelial cells (CD31, green) of microvessels within the peri-infarct region. Confocal image (right panel) of triple immunostaining shows that astrocytes (blue) surround a vessel with claudin-5 in endothelial cells (green). Scale bars=20 or 50 μm.
Figure 4
Figure 4
Increased expression of matrix metalloproteinase (MMP)-2 and MMP-3 in astrocytes and vascular pericytes in peri-infarct areas at 3 weeks of reperfusion. (A) Micrographs show the location of MMP-2 (red) in peri-infarct cortex. Increased expression of MMP-2 was seen in reactive astrocytes (green) around the border of lesion areas compared with nonischemic cortex. The endfeet of astrocytes expressing MMP-2 connect to vessels within peri-infarct areas (bottom panel, arrows). (B) Micrographs showing the location of MMP-3 (red) in peri-infarct cortex. Increased expression of MMP-3 was seen in peri-infarct cortex compared with nonischemic cortex. Large vessels (RECA1, green) are surrounded by cells expressing MMP-3 (arrows) but are not colocalized with MMP-3. Three-dimensional (3D) confocal microscopy analysis presents the spatial distribution of MMP-3 around vessels. (C) Confocal microscopy shows the cells that express MMP-3 around vessels are PDGFR-β-positive pericytes (green). 3D image showed pericytes expressing MMP-3 closely surrounded main vessels (arrows). Z-stack image shows colocalization of PDGFR-β with MMP-3 around microvessels with some pericytes expressing MMP-3 in contacting these vessels (arrows). 4′-6-diamidino-2-phenylinidole (DAPI) (blue) was used to stain nuclei. (D) Z-stack confocal micrograph shows colocalization of NG2 and MMP-3. Scale bars=20 or 50 μm.
Figure 5
Figure 5
Promotion of angiogenesis in ischemic hemisphere by early inhibition of matrix metalloproteinases (MMPs). (A) Micrographs representing RECA1 staining microvessels in peri-infarct areas in rat brains with or without GM6001 treatment at 3 weeks of reperfusion. Significantly higher number of microvessels were detected in GM6001-treated rat compared with vehicle, *P<0.05, n=6 per group. (B) Western blot analysis showing an increase in the VEGF-A level in ischemic rat brain tissues. **P<0.01 vs. 3 WK I and MMP inhibitor (MMPi) I; *P<0.05 vs. 3 WK C; #P<0.01 vs. MMPi C; ##P<0.01 vs. 3 WK C. Higher level of VEGF-A was detected in GM6001-treated ischemic hemispheres compared with vehicle-treated one, but not statistically significant. n=9 per group. (C) Western blot analysis showing changes in levels of activin receptor-like kinase (ALK) 1 and 5 in rat brain tissues. ALK1 level increased in ischemic rat brains at 3 weeks of reperfusion and treatment with MMPi significantly facilitated the expression of ALK1. *P<0.01 vs. sham and 3 WK C; #P<0.01 vs. MMPi C and 3 WK I; ##P<0.001 vs. sham and 3 WK C. The ALK5 level decreased at 3 weeks of reperfusion. *P<0.05 vs. 3 WK C, 3 WK I, and MMPi C; **P<0.01 vs. MMPi I. Treatment with MMPi reduced ALK5 expression compared with vehicle-treated group (3 WK), P=0.055. n=6 in sham group, 9 in vehicle and GM6001-treated groups.
Figure 6
Figure 6
Early inhibition of matrix metalloproteinases (MMPs) enhances expressions of tight junction proteins (TJPs) and MMPs at 3 weeks of reperfusion. (A) Western blot analysis of TJPs in sham-operated, nonischemic, and ischemic hemispheres. Zonula occludens-1 (ZO-1) (includes bands of 220 and 210 kDa): *P<0.05 vs. 3 WK C and MMP inhibitor (MMPi) C; #P<0.05 vs. sham; ###P<0.001 vs. 3 WK C and MMPi C. Occludin (includes bands of 65 and 63 kDa): *P<0.05 vs. 3 WK I; **P<0.01 vs. 3 WK C and MMPi C; #P<0.05 vs. 3 WK I; ##P<0.01 vs. 3 WK C; ###P<0.001 vs. MMPi C. Claudin-5 (includes bands of 22 and 17 kDa): *P<0.05 vs. sham; **P<0.01 vs. 3 WK C and MMPi C; #P<0.05 vs. 3 WK I. (B) Western blot analysis of MMP-2 and -3 in sham-operated, nonischemic, and ischemic hemispheres. MMP-2 includes pro-MMP-2 (68 kDa) and active MMP-2 (62 kDa). *P<0.05 vs. 3 WK C. ##P<0.01 vs. sham, 3 WK C, MMPi C, and MMPi I. MMP-3 includes pro-MMP-3 (57 kDa) and active MMP-3 (45 kDa). *P<0.05 vs. sham and 3 WK C; #P<0.05 vs. sham; ##P<0.01 vs. 3 WK C and MMPi C. Treatment with MMPi I increased MMP-3 expression compared with vehicle-treated group (3 WK I), P=0.051. n=6 in sham group, 9 in vehicle- and GM6001-treated groups.
Figure 7
Figure 7
Matrix metalloproteinase (MMP) inhibition improves outcomes by reducing brain tissue loss during recovery. (A) Cresyl violet acetate (CVA) staining represents tissue loss (blank areas) in ischemic hemispheres with or without GM6001 treatment at 3 weeks of reperfusion. Bar graphs show that treatment with GM6001 significantly reduced tissue loss. *P<0.05, n=6 per group. (B) Anatomic T2 magnetic resonance (MR) images show the tissue lesion extent (arrows) in ischemic hemispheres with or without GM6001 treatment at 4 weeks of reperfusion. Treatment with GM6001 significantly reduced the lesion size. Apparent diffusion coefficient (ADC) maps reconstructed from raw diffusion-weighted image (DWI) data show lesion regions of increased ADC values (hyperintense regions) with the region of lower value on the GM6001-treated ischemic hemisphere. *P<0.01, n=5 for each group. (C) Perfused brains shown in (B). After perfusion and fixation with 2% paraformaldehyde, the tissue loss in infarcted cortex in vehicle-treated brain was manifested as a collapse of the ischemic hemisphere (arrows). Reduced cavitation of infarcted cortex was seen in rats treated with GM6001.

References

    1. Hermann DM, Zechariah A. Implications of vascular endothelial growth factor for postischemic neurovascular remodeling. J Cereb Blood Flow Metab. 2009;29:1620–1643. - PubMed
    1. Arai K, Jin G, Navaratna D, Lo EH. Brain angiogenesis in developmental and pathological processes: neurovascular injury and angiogenic recovery after stroke. FEBS J. 2009;276:4644–4652. - PMC - PubMed
    1. Krupinski J, Kaluza J, Kumar P, Kumar S, Wang JM. Some remarks on the growth-rate and angiogenesis of microvessels in ischemic stroke. Morphometric and immunocytochemical studies. Patol Pol. 1993;44:203–209. - PubMed
    1. Zhu W, Fan Y, Hao Q, Shen F, Hashimoto T, Yang GY, et al. Postischemic IGF-1 gene transfer promotes neurovascular regeneration after experimental stroke. J Cereb Blood Flow Metab. 2009;29:1528–1537. - PMC - PubMed
    1. Shen F, Walker EJ, Jiang L, Degos V, Li J, Sun B, et al. Coexpression of angiopoietin-1 with VEGF increases the structural integrity of the blood-brain barrier and reduces atrophy volume. J Cereb Blood Flow Metab. 2011;31:2343–2351. - PMC - PubMed

Publication types

MeSH terms

Substances