Comparative Study
. 2013 Sep:78:186-95.
doi: 10.1016/j.neuroimage.2013.03.038. Epub 2013 Apr 6.

fMRI in the awake marmoset: somatosensory-evoked responses, functional connectivity, and comparison with propofol anesthesia

Affiliations
Comparative Study

fMRI in the awake marmoset: somatosensory-evoked responses, functional connectivity, and comparison with propofol anesthesia

Junjie V Liu et al. Neuroimage. 2013 Sep.

Abstract

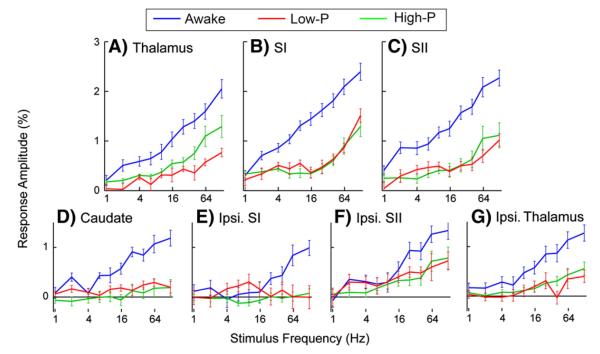
Functional neuroimaging in animal models is essential for understanding the principles of neurovascular coupling and the physiological basis of fMRI signals that are widely used to study sensory and cognitive processing in the human brain. While hemodynamic responses to sensory stimuli have been characterized in humans, animal studies are able to combine very high resolution imaging with invasive measurements and pharmacological manipulation. To date, most high-resolution studies of neurovascular coupling in small animals have been carried out in anesthetized rodents. Here we report fMRI experiments in conscious, awake common marmosets (Callithrix jacchus), and compare responses to animals anesthetized with propofol. In conscious marmosets, robust BOLD fMRI responses to somatosensory stimulation of the forearm were found in contralateral and ipsilateral regions of the thalamus, primary (SI) and secondary (SII) somatosensory cortex, and the caudate nucleus. These responses were markedly stronger than those in anesthetized marmosets and showed a monotonic increase in the amplitude of the BOLD response with stimulus frequency. On the other hand, anesthesia significantly attenuated responses in thalamus, SI and SII, and abolished responses in caudate and ipsilateral SI. Moreover, anesthesia influenced several other aspects of the fMRI responses, including the shape of the hemodynamic response function and the interareal (SI-SII) spontaneous functional connectivity. Together, these findings demonstrate the value of the conscious, awake marmoset model for studying physiological responses in the somatosensory pathway, in the absence of anesthesia, so that the data can be compared most directly to fMRI in conscious humans.


Figures

Fig. 1
Fig. 1
Illustration of slice profiles used in functional MRI. (A) Sagittal plane through midline showing anterior (AC) and posterior (PC) commissures. Sixteen coronal slices, each 750 μm thick, were prescribed orthogonal to AC–PC line. (B) One of the coronal slices cutting across AC. R = right side; L = left side.
Fig. 2
Fig. 2
Functional maps of the BOLD response evoked by electrical stimulation of the left forearm. Eight contiguous coronal slices immediately posterior to the anterior commissure (AC) are shown in representative sessions under each of the 3 anesthetic conditions: awake (A), low-propofol + fentanyl (Low-P, B) and high-propofol (High-P, C). Statistical significance of the stimulus-evoked response at all stimulation frequencies was measured by F-values derived from ANOVA, and the significance map was thresholded at a level correspondent to P < 10−4 (see Materials and methods). Thalamus (Tha.), Caudate (Cau.), SI and SII regions were identified using anatomical landmarks including AC and the lateral sulcus (masked by SII responses), and these regions showed predominantly contralateral responses that were stronger in awake than in anesthetized sessions. R = right side; L = left side.
Fig. 3
Fig. 3
Relationship of stimulus-evoked response amplitude with stimulus temporal frequency in 4 contralateral (A–D) and 3 ipsilateral (E–G) brain regions under awake (blue), low-propofol + fentanyl (red) and high-propofol (green) anesthesia. Error bars represent ±S.E.M. across all sessions (n = 12) obtained under each of the 3 anesthetic conditions. The current intensity of electrical stimulation was 1.5 mA in awake and low-propofol + fentanyl (Low-P) sessions, and 3.0 mA in high-propofol (High-P) sessions.
Fig. 4
Fig. 4
Time-series and temporal parametric values of stimulus-evoked responses in SI. Evoked responses (solid lines) and Gamma function fits (dotted lines) are shown for 4 Hz (A) and 62.5 Hz (B) stimulations that last from 0 s to 4 s (horizontal black bars). Error bars: ±S.E.M. across all sessions (n = 12). Based on the Gamma function fits, response time-to-peak values (C), and full-width-at-half-maximum (FWHM) (D), are estimated and shown in relation to stimulus frequency. Error bars: ±S.E.M. estimated using bootstrapping with replacement method across all sessions.
Fig. 5
Fig. 5
Maps of spontaneous functional connectivity to a seed region in right SI, under awake and anesthetized conditions. Each map shows the correlation coefficient between time series of each pixel and time series of the seed region. The same 3 representative sessions as in Fig. 2 are shown, with scale between 0.1 and 0.6 (see colorbar). An arrow in each middle panel marks right SII, which shows high connectivity to right SI (bright colors) in awake (A) and low-propofol + fentanyl (Low-P, B), but low connectivity (blue) in high-propofol (High-P, C) anesthesia.
Fig. 6
Fig. 6
Spontaneous functional connectivity between the two SI regions and between the two SII regions, and between the SI–SII regions, under awake, low-propofol + fentanyl (Low-P) and high-propofol (High-P) anesthesia. Each dot represents correlation coefficient computed from one scan without stimulus (800 s). Error bars: 1 Std. Dev. across scans. Stars denote significant differences (P < 0.001, Wilcoxon test).

References

    1. Alkire MT. Loss of effective connectivity during general anesthesia. Int. Anesthesiol. Clin. 2008;46:55–73. - PubMed
    1. Andersen AH, Zhang Z, Barber T, Rayens WS, Zhang J, Grondin R, Hardy P, Gerhardt GA, Gash DM. Functional MRI studies in awake rhesus monkeys: methodological and analytical strategies. J. Neurosci. Methods. 2002;118:141–152. - PubMed
    1. Attwell D, Iadecola C. The neural basis of functional brain imaging signals. Trends Neurosci. 2002;25:621–625. - PubMed
    1. Backes WH, Mess WH, van Kranen-Mastenbroek V, Reulen JP. Somatosensory cortex responses to median nerve stimulation: fMRI effects of current amplitude and selective attention. Clin. Neurophysiol. 2000;111:1738–1744. - PubMed
    1. Bandettini PA. Twenty years of functional MRI: the science and the stories. Neuroimage. 2012;62:575–588. - PubMed

Publication types

MeSH terms