Review
. 2013 Oct 15:80:349-59.
doi: 10.1016/j.neuroimage.2013.04.001. Epub 2013 Apr 6.

Resting-state fMRI confounds and cleanup

Affiliations
Review

Resting-state fMRI confounds and cleanup

Kevin Murphy et al. Neuroimage. .

Abstract

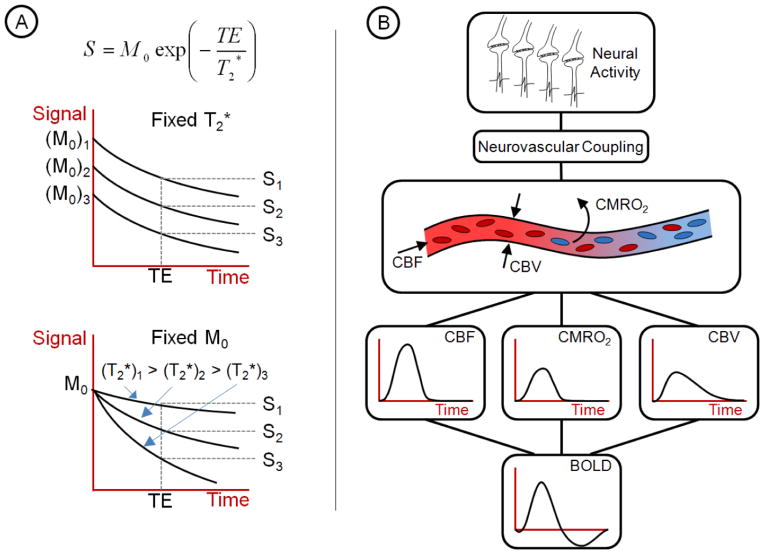
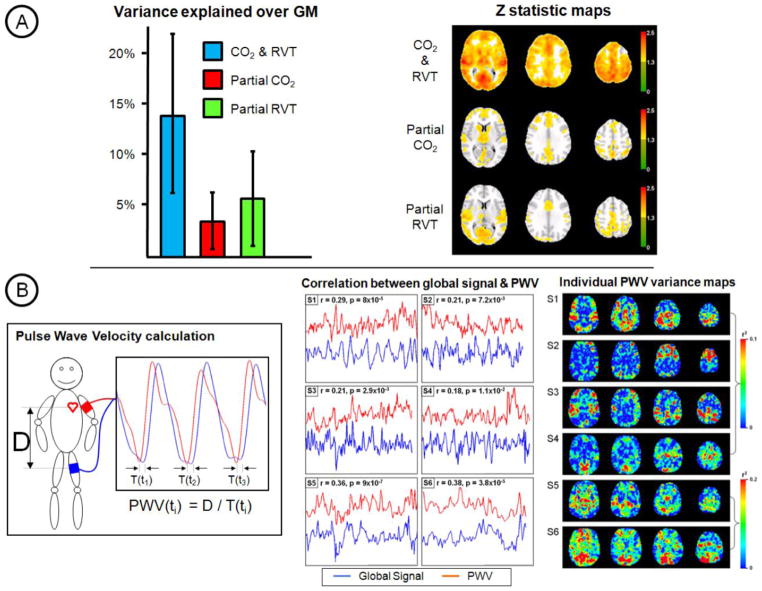
The goal of resting-state functional magnetic resonance imaging (fMRI) is to investigate the brain's functional connections by using the temporal similarity between blood oxygenation level dependent (BOLD) signals in different regions of the brain "at rest" as an indicator of synchronous neural activity. Since this measure relies on the temporal correlation of fMRI signal changes between different parts of the brain, any non-neural activity-related process that affects the signals will influence the measure of functional connectivity, yielding spurious results. To understand the sources of these resting-state fMRI confounds, this article describes the origins of the BOLD signal in terms of MR physics and cerebral physiology. Potential confounds arising from motion, cardiac and respiratory cycles, arterial CO₂ concentration, blood pressure/cerebral autoregulation, and vasomotion are discussed. Two classes of techniques to remove confounds from resting-state BOLD time series are reviewed: 1) those utilising external recordings of physiology and 2) data-based cleanup methods that only use the resting-state fMRI data itself. Further methods that remove noise from functional connectivity measures at a group level are also discussed. For successful interpretation of resting-state fMRI comparisons and results, noise cleanup is an often over-looked but essential step in the analysis pipeline.

Keywords: Functional connectivity; Functional magnetic resonance imaging (fMRI); Noise correction; Physiological noise; Resting-state.


Figures

Figure 1
Figure 1. Origins of the BOLD signal
A) The magnitude of the BOLD signal depends on the initial magnetisation, M0, and the decay time, T2*. Changes in the BOLD signal strength, S, can arise from changes in either M0, T2* or a combination of both. FMRI assumes that changes in T2* are solely due to neural activity-related changes in deoxyhaemoglobin concentration. B) A schematic of the relationship between a transient increase in neural activity and the corresponding BOLD signal is shown. When neural activity causes increased oxygen consumption (CMRO2), neurovascular coupling mechanisms alter the tone of the vasculature changing CBF and CBV. The complicated interaction between these 3 parameters leads to the BOLD signal as measured with FMRI. Changes in the BOLD signal accurately reflect neural activity fluctuations, only if the intermediary vascular steps are not significantly altered. Many of the confounds in resting-state FMRI originate from physiological changes in the vasculature.
Figure 2
Figure 2. CO2 and PWV resting-state FMRI confounds
A) A comparison of CO2 and RVT correction is shown for a cohort of 12 subjects. Together, RVT and end-tidal CO2 traces can explain ~15% of the variance in resting BOLD fluctuations. These confounds are widespread throughout gray matter. Although, common variance is removed, each type of correction captures a separate component of the noise. Complementary variance is explained in spatially similar and distinct regions. (Data first presented as a poster at the ISMRM 2009 meeting – Murphy, K., Harris, A.D. Niazy, R.K., Evans, C.J. & Wise, R.G. Low-Frequency Respiration Related Signals in Resting State fMRI: a comparison of end-tidal CO2 and respiration volume per time.) B) Pulse wave velocity (PWV) can be measured using partially inflated blood pressure cuffs. This measure of arterial stiffness reflects sympathetic tone that is related to fluctuations in arterial blood pressure. Although PWV measures are inherently noisy, large correlations with the global BOLD signal can be observed (over 6 subjects). Voxel-wise correlations of BOLD signal with PWV show localisation of explained variance in highly vascular regions for some subjects. This demonstrates that blood pressure fluctuations may be a large source of confound for resting-state FMRI that, to date, has been largely ignored by researchers. (Data first presented as an e-poster at the ISMRM 2011 meeting – Murphy, K., Coulson, J., Harris, A.D. Fjordorova, M. & Wise, R.G. The association between pulse wave velocity, as a marker of sympathetic tone, and resting state BOLD signals.)

Similar articles

Cited by

References

    1. Aalkjaer C, Boedtkjer D, Matchkov V. Vasomotion - what is currently thought? Acta Physiol (Oxf) 2011;202:253–269. - PubMed
    1. Akselrod S, Gordon D, Ubel FA, Shannon DC, Berger AC, Cohen RJ. Power spectrum analysis of heart rate fluctuation: a quantitative probe of beat-to-beat cardiovascular control. Science. 1981;213:220–222. - PubMed
    1. Anderson JS, Druzgal TJ, Lopez-Larson M, Jeong EK, Desai K, Yurgelun-Todd D. Network anticorrelations, global regression, and phase-shifted soft tissue correction. Hum Brain Mapp. 2011;32:919–934. - PMC - PubMed
    1. Attwell D, Laughlin SB. An energy budget for signaling in the grey matter of the brain. J Cereb Blood Flow Metab. 2001;21:1133–1145. - PubMed
    1. Bandettini PA, Jesmanowicz A, Wong EC, Hyde JS. Processing strategies for time-course data sets in functional MRI of the human brain. Magn Reson Med. 1993;30:161–173. - PubMed

Publication types