. 2014 Jan;7(1):38-45.
doi: 10.1038/mi.2013.20. Epub 2013 Apr 10.

Chronic dry eye disease is principally mediated by effector memory Th17 cells

Affiliations

Chronic dry eye disease is principally mediated by effector memory Th17 cells

Y Chen et al. Mucosal Immunol. 2014 Jan.

Abstract

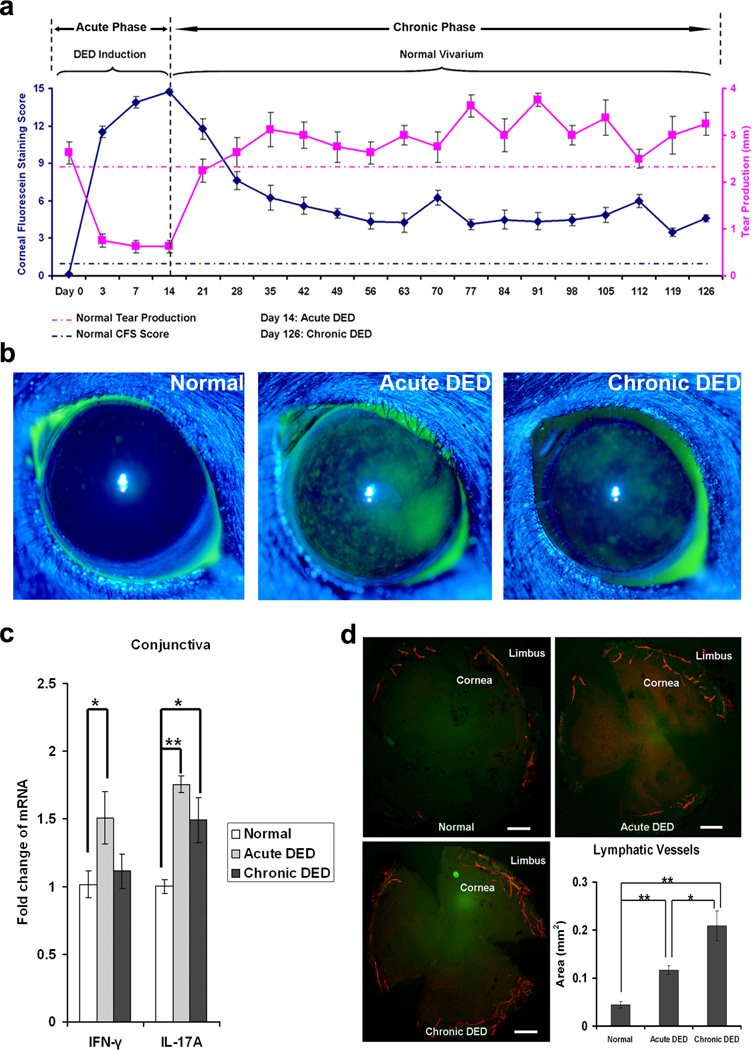
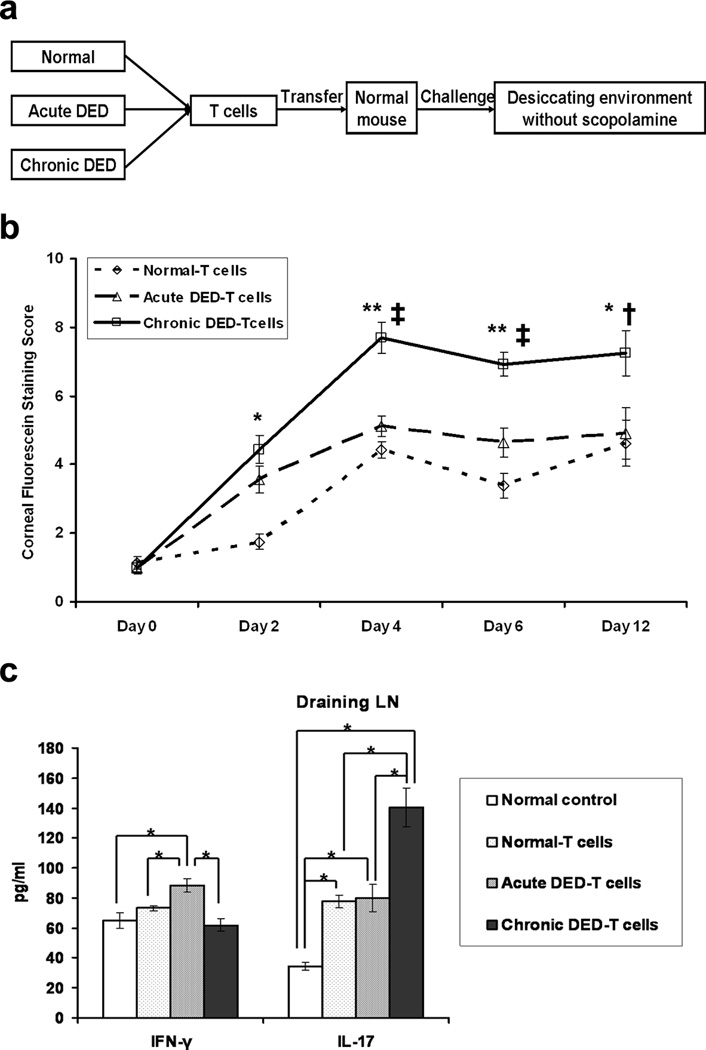
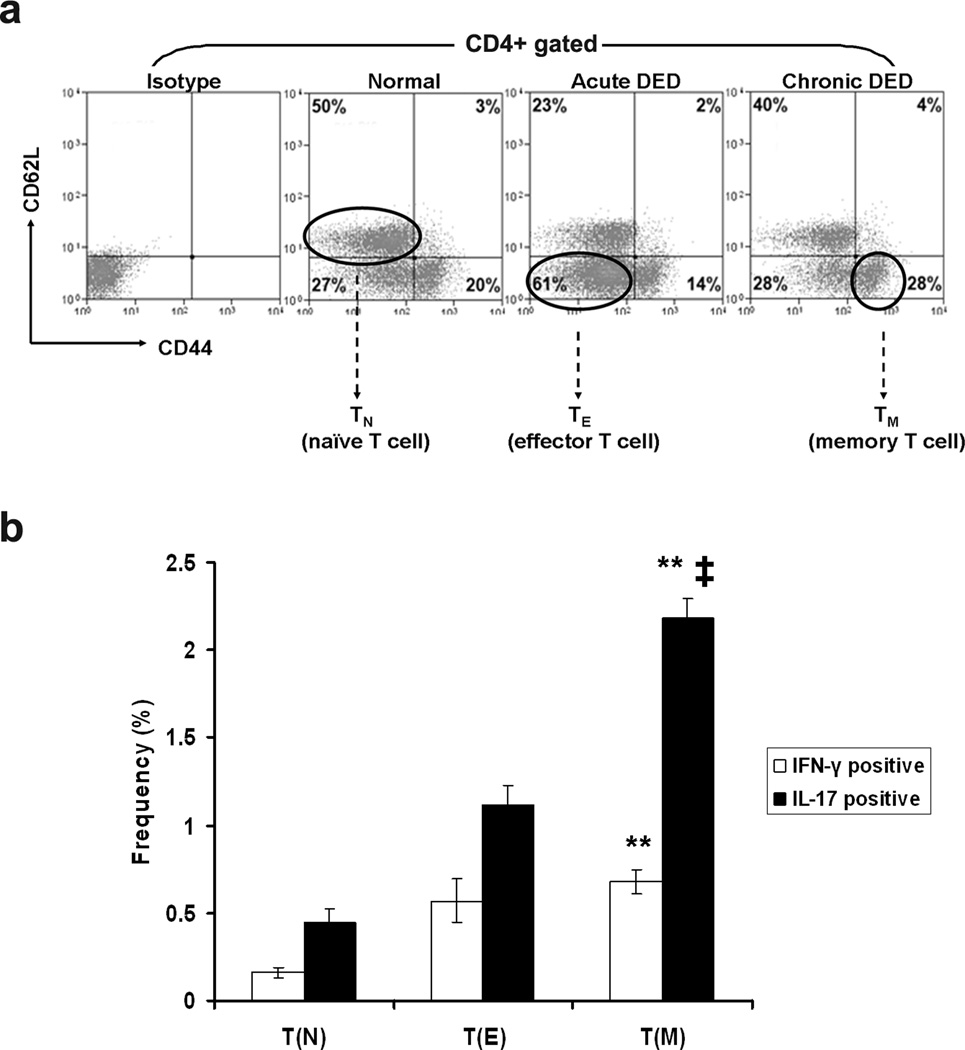
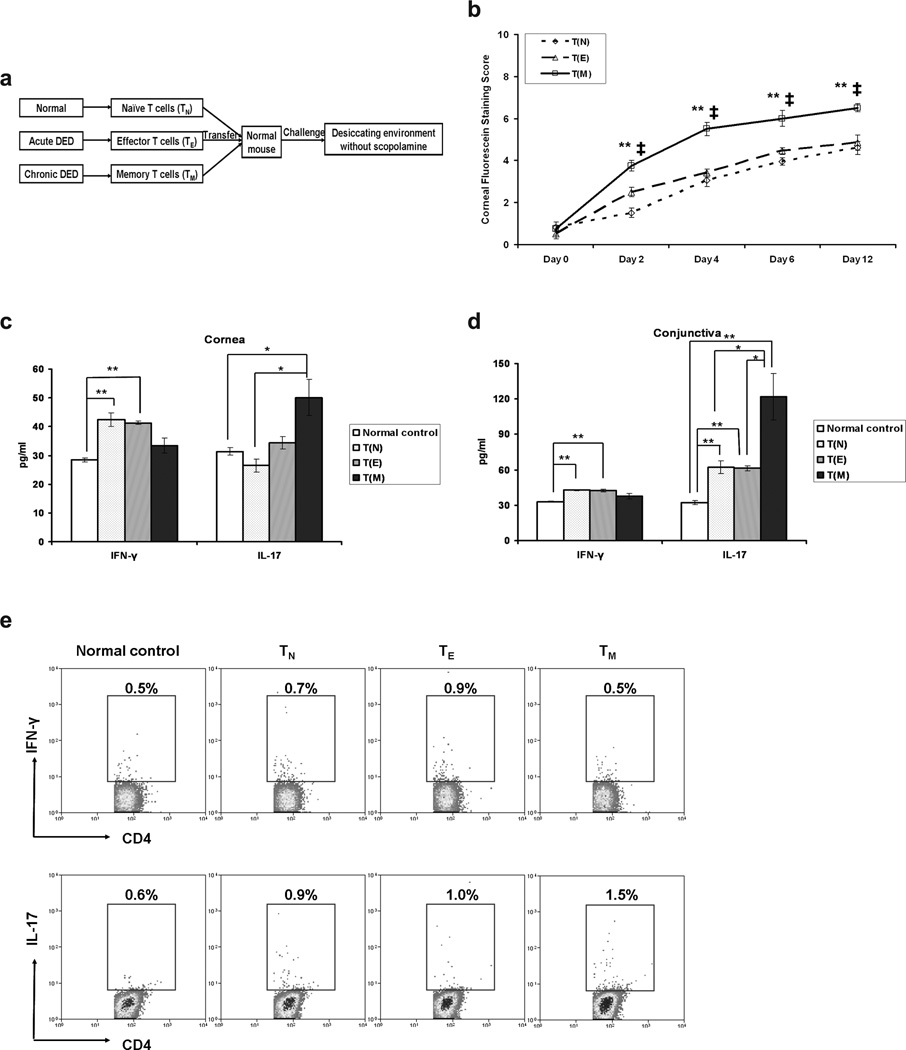
Recent experimental and clinical data suggest that there is a link between dry eye disease (DED) and T-cell-mediated immunity. However, whether these immune responses are a consequence or cause of ocular surface inflammation remains to be determined. Thus far, only models of acute DED have been used to derive experimental data. This is in contrast to clinical DED which usually presents as a chronic disease. In the present study, using a murine model of chronic DED, it was established that the chronic phase of the disease is accompanied by T helper type 17 (Th17) responses at the ocular surface and that a significant memory T-cell population can be recovered from chronic DED. This memory response is predominantly mediated by Th17 cells. Moreover, adoptive transfer of this memory T-cell population was shown to induce more severe and rapidly progressing DED than did the adoptive transfer of its effector or naive counterparts. Not only do these results clearly demonstrate that effector memory Th17 cells are primarily responsible for maintaining the chronic and relapsing course of DED, but they also highlight a potentially novel therapeutic strategy for targeting memory immune responses in patients with DED.


Conflict of interest statement

Conflict of interest: None.

Figures

Figure 1
Figure 1
Chronic dry eye disease (DED) involves immunoinflammatory responses at the ocular surface. (a) Development of chronic DED. Acute DED was induced in mice by desiccating stress for 14 d. Subsequently, mice were transferred to the normal vivarium without anti-cholinergic challenge and observed until day 126. Low-level corneal epitheliopathy persisted as evidenced by a slight elevation in corneal fluorescein staining scores (solid blue line) which were evaluated in a masked fashion. Meanwhile, aqueous tear production, as assessed with the cotton thread test, returned to normal or even supranormal levels (solid pink line). Age and sex-matched mice maintained in the standard environment were used as normal controls with mean levels of corneal fluorescein staining scores and tear production shown in dash blue and pink lines, respectively. Data shown represent the mean ± SEM of a single trial (n = 10 eyes) out of two performed. (b) Representative corneal fluorescein staining images of normal, acute DED (day 14) and chronic DED (day 126). (c) Relative quantification of IFN-γ and IL-17 mRNA levels in the conjunctiva. Data represent the mean ± SEM of six eyes per group from a single experiment that was reproduced in a similar independent experiment. *, p < 0.05; **, p < 0.01. (d) Representative whole-mount corneal immunofluorescence micrographs demonstrating lymphangiogenesis in DED. Corneas were stained with CD31 (green) and LYVE-1 (red) to evaluate blood (CD31hiLYVE-1) and lymphatic (CD31loLYVE-1+) vessels. Scale bars, 50 µm. The corneal area covered by lymphatic vessels were quantified using Fiji software, and presented in a bar graph. *, p < 0.05; **, p < 0.01.
Figure 2
Figure 2
T cells from chronic dry eye disease (DED) mice induce the most severe disease in naïve recipients. (a) Schematic study design of adoptive transfer experiment. Total T cells were isolated from normal, acute and chronic DED (n = 3–5 mice/group). Each naïve recipient was then injected i.v. with 1 × 10⁶ cells. Recipients were challenged in the controlled-environment chamber for 22 d without use of scopolamine. (b) Disease severity comparison among the recipients transferred with the different T cells. The mean corneal fluorescein staining score ± SEM for each group (n = 16 eyes) is shown. *, p < 0.05; **, p < 0.01 compared to normal-T cell recipients. †, p < 0.05; ‡, p < 0.01 compared to acute DED-T cell recipients. (c) T cell response at the recipient ocular surface. Conjunctival tissue was collected from the recipients at day 6, and relative mRNA expression of IFN-γ and IL-17 transcripts (n = 6 eyes per group) was quantified. Data shown are mean ± SEM. *, p < 0.05; **, p < 0.01. (d) T cell response in the recipient draining lymph nodes (LNs). Draining LNs were harvested at day 6, and analyzed for IFN-γ and IL-17 levels by ELISA (n = 3 mice per group). Data shown are mean ± SEM. *, p < 0.05. Groups are labeled as follows: Normal T-cells, recipients of T cells from normal mice; Acute DED-T cells, recipients of T cells from acute DED mice; Chronic DED-T cells, recipients of T cells from chronic DED mice.
Figure 3
Figure 3
T cells from chronic DED show increased effector memory Th17 population. Draining lymph node cells and spleen cells from normal, acute and chronic DED mice were analyzed by flow cytometry. Representative results from spleens are shown, with similar findings in draining lymph nodes. (a) CD62L versus CD44 expression on gated CD4+ cells is presented. Four T cell populations were differentiated: CD62L+CD44lo naïve T cells (TN), CD62LCD44lo effector T cells (TE), CD62L+CD44hi central memory T cells, and CD62LCD44hi effector memory T cells (TM). Percentages indicate frequencies of each cell population. (b) Sorted TN from normal, TE from acute, and TM from chronic DED were further analyzed for IFN-γ and IL-17 expression. Frequencies of IFN-γ+ or IL-17+ cells in each individual populations are summarized as mean ± SEM of three independent experiments shown in the bar graph. **, p < 0.01 compared to TN. ‡, p < 0.01 compared to TE.
Figure 4
Figure 4
Effector memory T cells (TM) from chronic dry eye disease (DED) mice induce the most severe disease in naïve recipients. (a) Schematic study design of adoptive transfer experiment. Draining lymph nodes and spleens from normal, acute and chronic DED mice were harvested. CD62L+CD44lo naïve T cells (TN) from normal, CD62LCD44lo effector T cells (TE) from acute, and CD62LCD44hi effector memory T cells (TM) from chronic DED were sorted with CD4 beads (negative selection) and FACS. Each naïve recipient was then injected i.v. with 3 × 10⁵ TN, TE, or TM cells. Recipients were challenged with the controlled-environment chamber for 12 d without use of scopolamine. (b) Clinical disease evaluation among the recipients transferred with different cells. The mean corneal fluorescein staining score ± SEM for TN (n = 10 eyes), TE (n = 12 eyes), or TM (n = 8 eyes) recipients is shown. *, p < 0.05; **, p < 0.01 compared to TN recipients. ‡, p < 0.01 compared to TE recipients. (c, d) T cell response at the recipient ocular surface. Cornea (c) and conjunctiva (d) were collected from the recipient mice in (b) at day 12, and analyzed for IFN-γ and IL-17 levels by ELISA. Data shown represent the mean ± SEM of a single experiment out of two performed (n = 5–9 eyes per group). *, p < 0.05; **, p < 0.01. (e) T cell response in the recipient draining lymph nodes. Single cell suspension was prepared from lymph nodes and analyzed by flow cytometry for IFN-γ+CD4+ Th1 and IL-17+CD4+ Th17 cells. The indicated percentages of Th1 or Th17 cells as a proportion of total CD4+ T cells in the representative flow cytometry dot plots were measured in different recipient groups. Groups labeled as: T(N), recipients of naïve T cells from normal mice; T(E), recipients of effector T cells from acute DED mice; T(M), recipients of effector memory T cells from chronic DED mice.

Similar articles

Cited by

References

    1. Schaumberg DA, Sullivan DA, Buring JE, Dana MR. Prevalence of dry eye syndrome among US women. Am. J. Ophthalmol. 2003;136:318–326. - PubMed
    1. Schaumberg DA, Dana R, Buring JE, Sullivan DA. Prevalence of dry eye disease among US men: estimates from the Physicians' Health Studies. Arch. Ophthalmol. 2009;127:763–768. - PMC - PubMed
    1. Subcommittee of the international Dry Eye Workshop. The definition and classification of dry eye disease: report of the Definition and Classification. Ocul. Surf. 2007;5:75–92. - PubMed
    1. Stern ME, et al. Conjunctival T cell subpopulations in Sjögren's and non-Sjögren's patients with dry eye. Invest. Ophthalmol. Vis. Sci. 2002;43:2609–2614. - PubMed
    1. Kunert KS, Tisdale AS, Stern ME, Smith JA, Gipson IK. Analysis of topical cyclosporine treatment of patients with dry eye syndrome: effect on conjunctival lymphocytes. Arch. Ophthalmol. 2000;118:1489–1496. - PubMed

Publication types