

Optimization of dual-energy xenon-computed tomography for quantitative assessment of regional pulmonary ventilation
- PMID: 23571834
- PMCID: PMC3873149
- DOI: 10.1097/RLI.0b013e31828ad647
Optimization of dual-energy xenon-computed tomography for quantitative assessment of regional pulmonary ventilation
Abstract
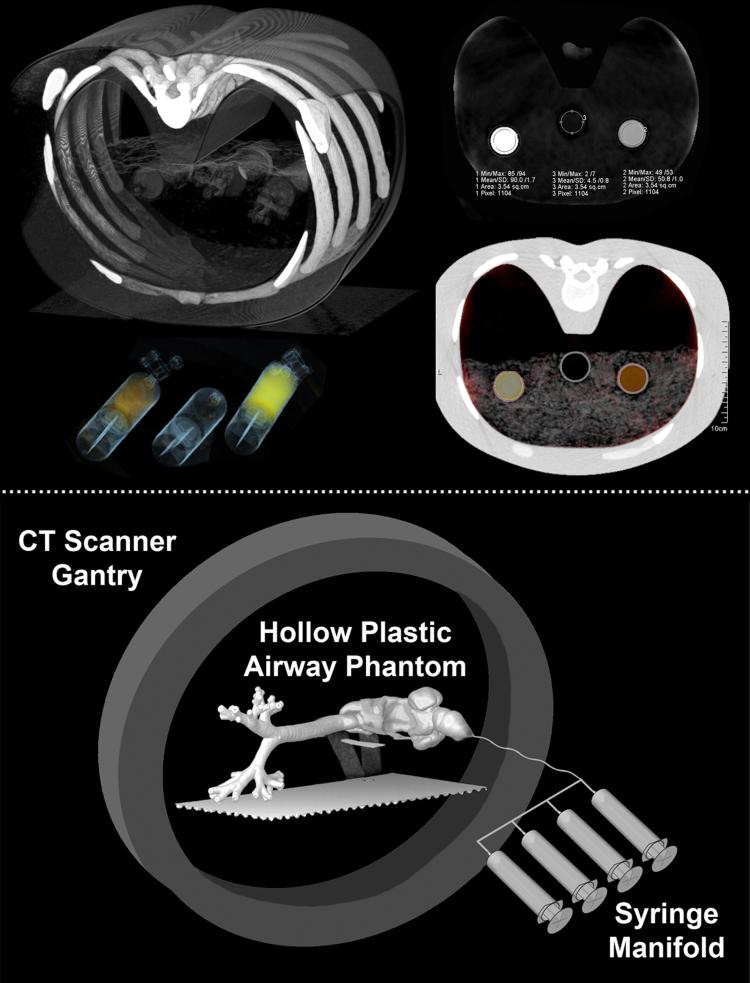
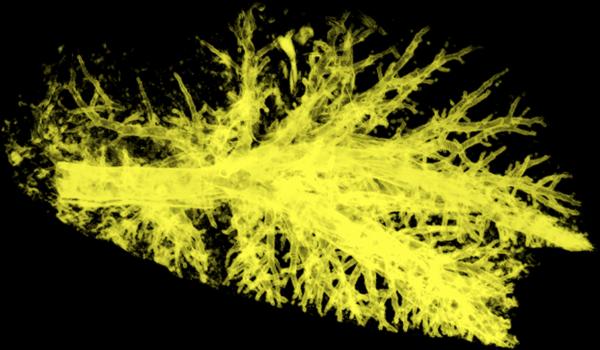
Objective: Dual-energy x-ray computed tomography (DECT) offers visualization of the airways and quantitation of regional pulmonary ventilation using a single breath of inhaled xenon gas. In this study, we sought to optimize scanning protocols for DECT xenon gas ventilation imaging of the airways and lung parenchyma and to characterize the quantitative nature of the developed protocols through a series of test-object and animal studies.
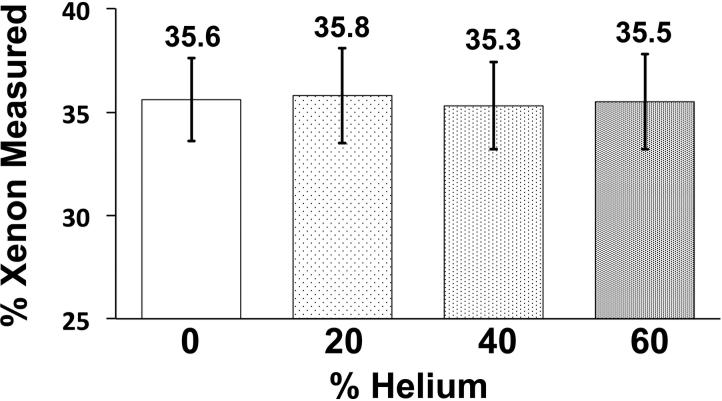
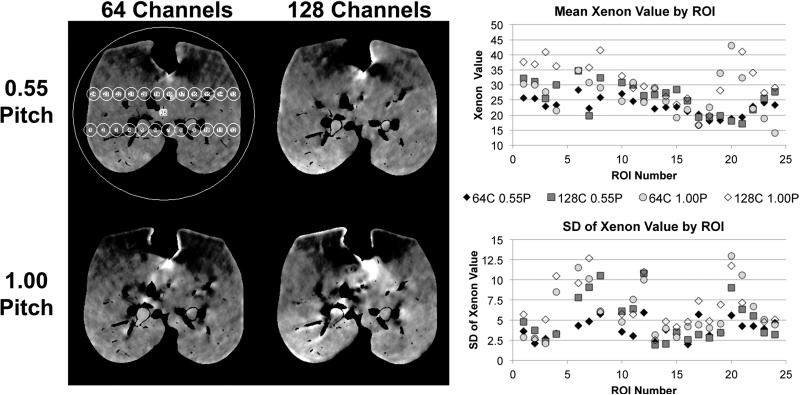
Materials and methods: The Institutional Animal Care and Use Committee approved all animal studies reported here. A range of xenon/oxygen gas mixtures (0%, 20%, 25%, 33%, 50%, 66%, 100%; balance oxygen) were scanned in syringes and balloon test-objects to optimize the delivered gas mixture for assessment of regional ventilation while allowing for the development of improved 3-material decomposition calibration parameters. In addition, to alleviate gravitational effects on xenon gas distribution, we replaced a portion of the oxygen in the xenon/oxygen gas mixture with helium and compared gas distributions in a rapid-prototyped human central-airway test-object. Additional syringe tests were performed to determine if the introduction of helium had any effect on xenon quantitation. Xenon gas mixtures were delivered to anesthetized swine to assess airway and lung parenchymal opacification while evaluating various DECT scan acquisition settings.
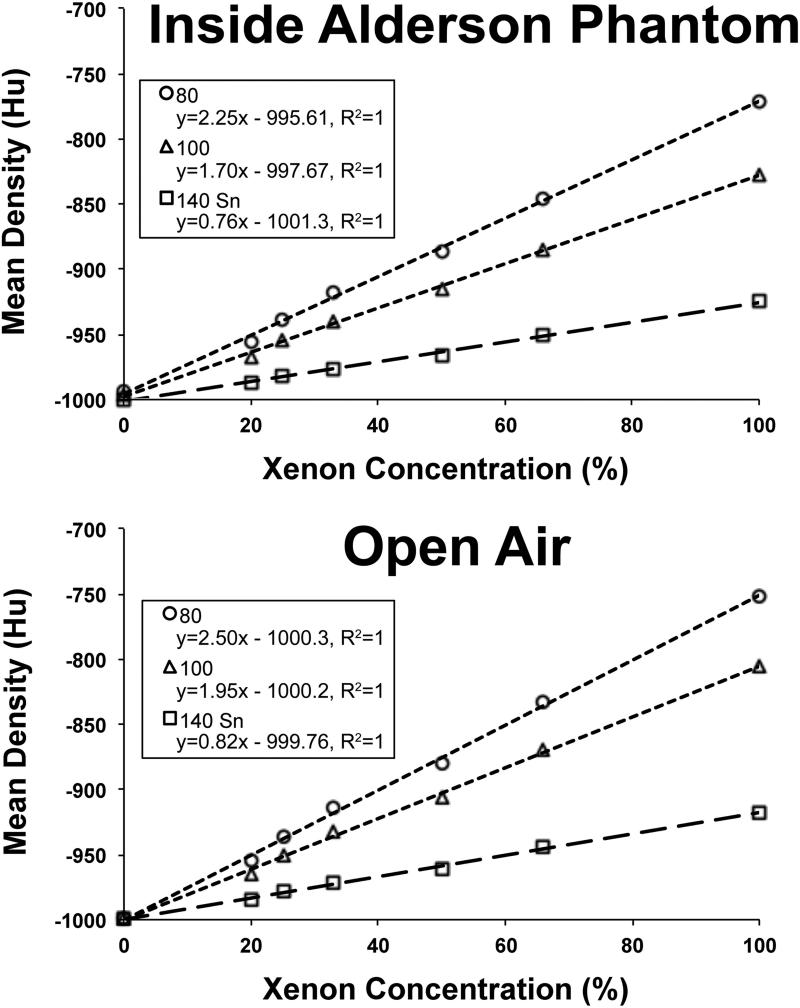
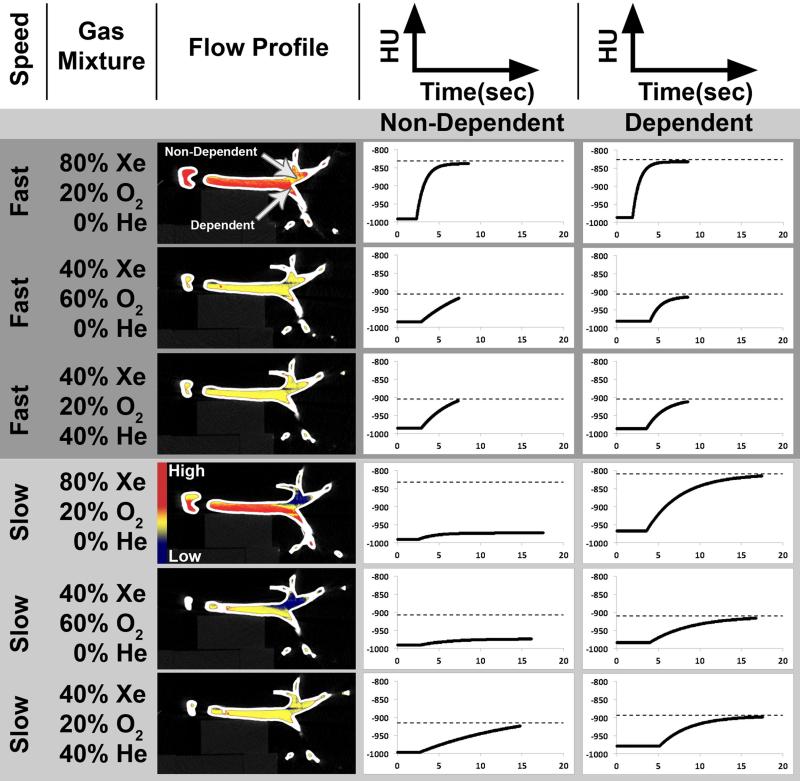
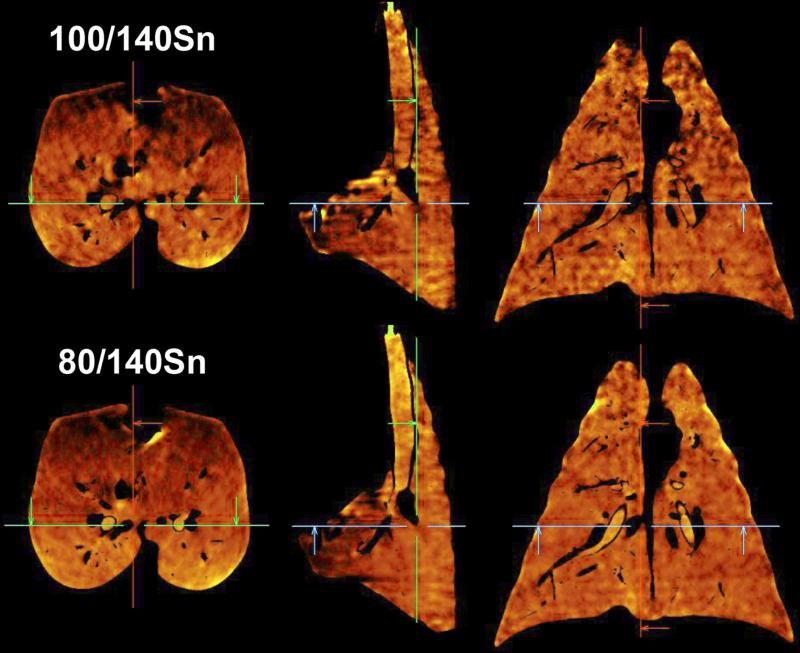
Results: Attenuation curves for xenon were obtained from the syringe test-objects and were used to develop improved 3-material decomposition parameters (Hounsfield unit enhancement per percentage xenon: within the chest phantom, 2.25 at 80 kVp, 1.7 at 100 kVp, and 0.76 at 140 kVp with tin filtration; in open air, 2.5 at 80 kVp, 1.95 at 100 kVp, and 0.81 at 140 kVp with tin filtration). The addition of helium improved the distribution of xenon gas to the gravitationally nondependent portion of the airway tree test-object, while not affecting the quantitation of xenon in the 3-material decomposition DECT. The mixture 40% Xe/40% He/20% O2 provided good signal-to-noise ratio (SNR), greater than the Rose criterion (SNR > 5), while avoiding gravitational effects of similar concentrations of xenon in a 60% O2 mixture. Compared with 100/140 Sn kVp, 80/140 Sn kVp (Sn = tin filtered) provided improved SNR in a swine with an equivalent thoracic transverse density to a human subject with a body mass index of 33 kg/m. Airways were brighter in the 80/140 Sn kVp scan (80/140 Sn, 31.6%; 100/140 Sn, 25.1%) with considerably lower noise (80/140 Sn, coefficient of variation of 0.140; 100/140 Sn, coefficient of variation of 0.216).
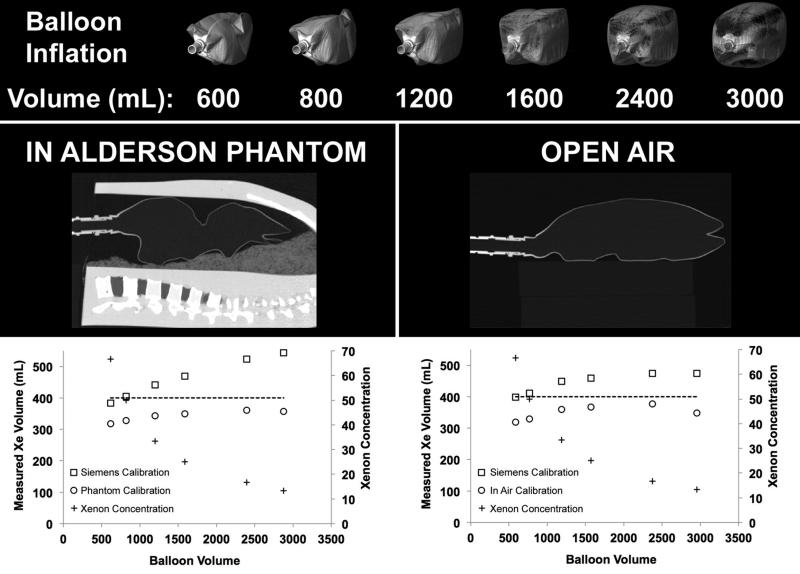
Conclusion: To provide a truly quantitative measure of regional lung function with xenon-DECT, the basic protocols and parameter calibrations need to be better understood and quantified. It is critically important to understand the fundamentals of new techniques to allow for proper implementation and interpretation of their results before widespread usage. With the use of an in-house derived xenon calibration curve for 3-material decomposition rather than the scanner supplied calibration and a xenon/helium/oxygen mixture, we demonstrate highly accurate quantitation of xenon gas volumes and avoid gravitational effects on gas distribution. This study provides a foundation for other researchers to use and test these methods with the goal of clinical translation.
Figures
Similar articles
-
Imaging of ventilation with dual-energy CT during breath hold after single vital-capacity inspiration of stable xenon.Radiology. 2012 Jan;262(1):262-8. doi: 10.1148/radiol.11110569. Epub 2011 Oct 24. Radiology. 2012. PMID: 22025733
-
Improved dose calculation accuracy for low energy brachytherapy by optimizing dual energy CT imaging protocols for noise reduction using sinogram affirmed iterative reconstruction.Z Med Phys. 2016 Mar;26(1):75-87. doi: 10.1016/j.zemedi.2015.09.001. Epub 2015 Oct 1. Z Med Phys. 2016. PMID: 26422576
-
Assessment of regional emphysema, air-trapping and Xenon-ventilation using dual-energy computed tomography in chronic obstructive pulmonary disease patients.Eur Radiol. 2017 Jul;27(7):2818-2827. doi: 10.1007/s00330-016-4657-z. Epub 2016 Nov 23. Eur Radiol. 2017. PMID: 27882425
-
Dual-energy CT revisited with multidetector CT: review of principles and clinical applications.Diagn Interv Radiol. 2011 Sep;17(3):181-94. doi: 10.4261/1305-3825.DIR.3860-10.0. Epub 2010 Nov 14. Diagn Interv Radiol. 2011. PMID: 20945292 Review.
-
Dual-energy CT of the lung.AJR Am J Roentgenol. 2012 Nov;199(5 Suppl):S40-53. doi: 10.2214/AJR.12.9112. AJR Am J Roentgenol. 2012. PMID: 23097167 Review.
Cited by
-
Pulmonary CT and MRI phenotypes that help explain chronic pulmonary obstruction disease pathophysiology and outcomes.J Magn Reson Imaging. 2016 Mar;43(3):544-57. doi: 10.1002/jmri.25010. Epub 2015 Jul 22. J Magn Reson Imaging. 2016. PMID: 26199216 Free PMC article. Review.
-
Assessment of Heterogeneity in Lung Structure and Function During Mechanical Ventilation: A Review of Methodologies.J Eng Sci Med Diagn Ther. 2022 Nov 1;5(4):040801. doi: 10.1115/1.4054386. Epub 2022 May 11. J Eng Sci Med Diagn Ther. 2022. PMID: 35832339 Free PMC article. Review.
-
Functional lung imaging in thoracic tumor radiotherapy: Application and progress.Front Oncol. 2022 Sep 23;12:908345. doi: 10.3389/fonc.2022.908345. eCollection 2022. Front Oncol. 2022. PMID: 36212454 Free PMC article. Review.
-
Ventilation/Perfusion Relationships and Gas Exchange: Measurement Approaches.Compr Physiol. 2020 Jul 8;10(3):1155-1205. doi: 10.1002/cphy.c180042. Compr Physiol. 2020. PMID: 32941684 Free PMC article. Review.
-
Regional Gas Transport During Conventional and Oscillatory Ventilation Assessed by Xenon-Enhanced Computed Tomography.Ann Biomed Eng. 2021 Sep;49(9):2377-2388. doi: 10.1007/s10439-021-02767-2. Epub 2021 May 4. Ann Biomed Eng. 2021. PMID: 33948747 Free PMC article.
References
-
- Foley WD, Haughton VM, Schmidt J, et al. Xenon contrast enhancement in computed body tomography. Radiology. 1978;129(1):219–220. - PubMed
-
- Park E-A, Goo JM, Park SJ, et al. Chronic Obstructive Pulmonary Disease: Quantitative and Visual Ventilation Pattern Analysis at Xenon Ventilation CT Performed by Using a Dual-Energy Technique. Radiology. 2010;256(3):985–997. - PubMed
-
- Chae EJ, Seo JB, Kim N, et al. Collateral Ventilation in a Canine Model with Bronchial Obstruction: Assessment with Xenon-enhanced Dual-Energy CT. Radiology. 2010;255(3):790–798. - PubMed
-
- Chon D, Simon BA, Beck KC, et al. Differences in regional wash-in and wash-out time constants for xenon-CT ventilation studies. Respiratory Physiology & Neurobiology. 2005;148(1-2):65–83. - PubMed
Publication types
MeSH terms
Substances
Grants and funding
LinkOut - more resources
Full Text Sources
Other Literature Sources
Medical
