

Circuit-level input integration in bacterial gene regulation
- PMID: 23572583
- PMCID: PMC3637709
- DOI: 10.1073/pnas.1216091110
Circuit-level input integration in bacterial gene regulation
Abstract
Gene regulatory circuits can receive multiple simultaneous inputs, which can enter the system through different locations. It is thus necessary to establish how these genetic circuits integrate multiple inputs as a function of their relative entry points. Here, we use the dynamic circuit regulating competence for DNA uptake in Bacillus subtilis as a model system to investigate this issue. Specifically, we map the response of single cells in vivo to a combination of (i) a chemical signal controlling the constitutive expression of key competence genes, and (ii) a genetic perturbation in the form of copy number variation of one of these genes, which mimics the level of stress signals sensed by the bacteria. Quantitative time-lapse fluorescence microscopy shows that a variety of dynamical behaviors can be reached by the combination of the two inputs. Additionally, the integration depends strongly on the relative locations where the two perturbations enter the circuit. Specifically, when the two inputs act upon different circuit elements, their integration generates novel dynamical behavior, whereas inputs affecting the same element do not. An in silico bidimensional bifurcation analysis of a mathematical model of the circuit offers good quantitative agreement with the experimental observations, and sheds light on the dynamical mechanisms leading to the different integrated responses exhibited by the gene regulatory circuit.
Conflict of interest statement
The authors declare no conflict of interest.
Figures
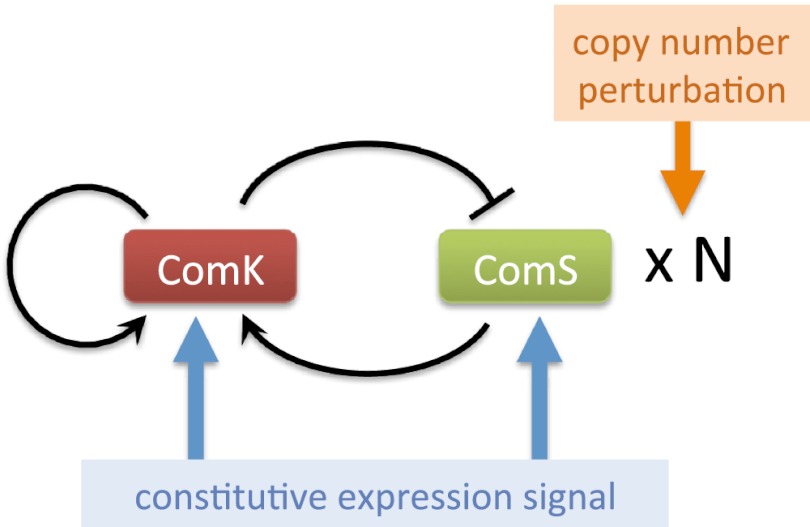
 , and the ComS copy number,
  , whereas in the lower row, the constitutive expression of ComK,
  , is varied together with
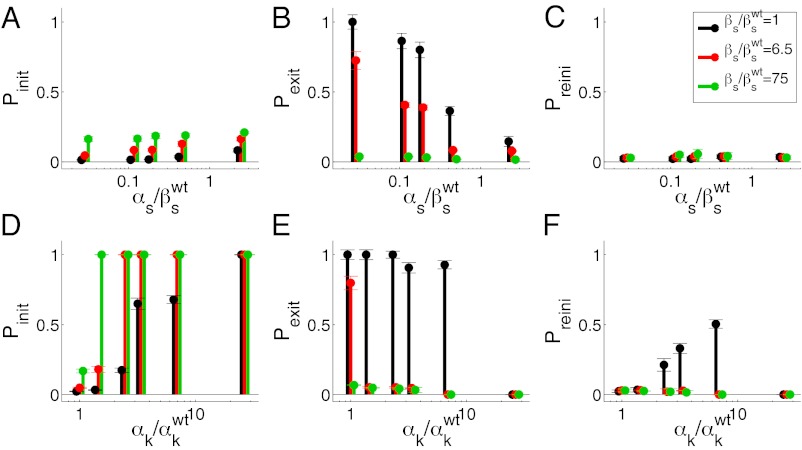
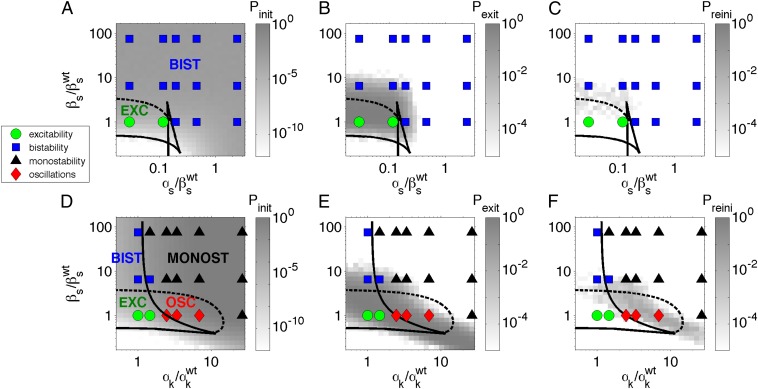
  . The symbols represent the experimental observations, with green circles corresponding to excitable dynamics (here defined by
  and
and  ), blue squares to bistable behavior (
 if
if  : a fraction of the cells turn on competence and stay there, representative of spatial heterogeneity between two stable states; or
  if
if  : most cells turn on competence and come back, representative of temporal switching between two stable states), black triangles to monostable competence (
 and
and  ), and red diamonds to oscillatory dynamics (
 ). Lines represent bifurcation boundaries of a deterministic mathematical model of the competence circuit (see text), as computed with the numerical continuation software AUTO through XPP; solid lines correspond to saddle-node bifurcations and dashed lines to Hopf bifurcations. The symbols and lines are the same among the three columns, which differ in the quantities plotted in grayscale, obtained from discrete simulations of the competence circuit:
  (A and D),
  (B and E), and
  (C and F). Parameters of the deterministic model are
  ,
,  ,
,  ,
,  ,
,  ,
,  ,
,  ,
,  , and
, and  . Parameters of the discrete model are given in
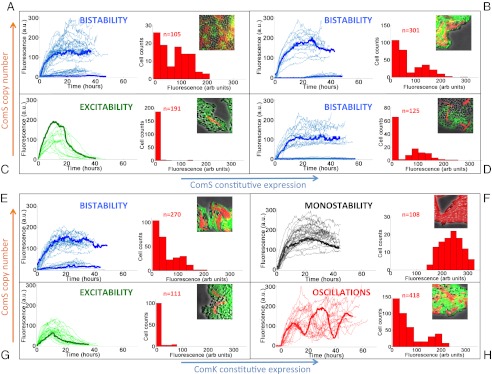
 ,
,  ; (B)
; (B)  ,
,  ; (C)
; (C)  ,
,  ; and (D)
  ,
,  . The four lower panels correspond to joint variation of the ComS copy number (increasing vertically toward the right) and the ComK constitutive expression level (increasing horizontally toward the right): (E)
  ,
,  ; (F)
; (F)  ,
,  ; (G)
; (G)  ,
,  ; and (H)
  ,
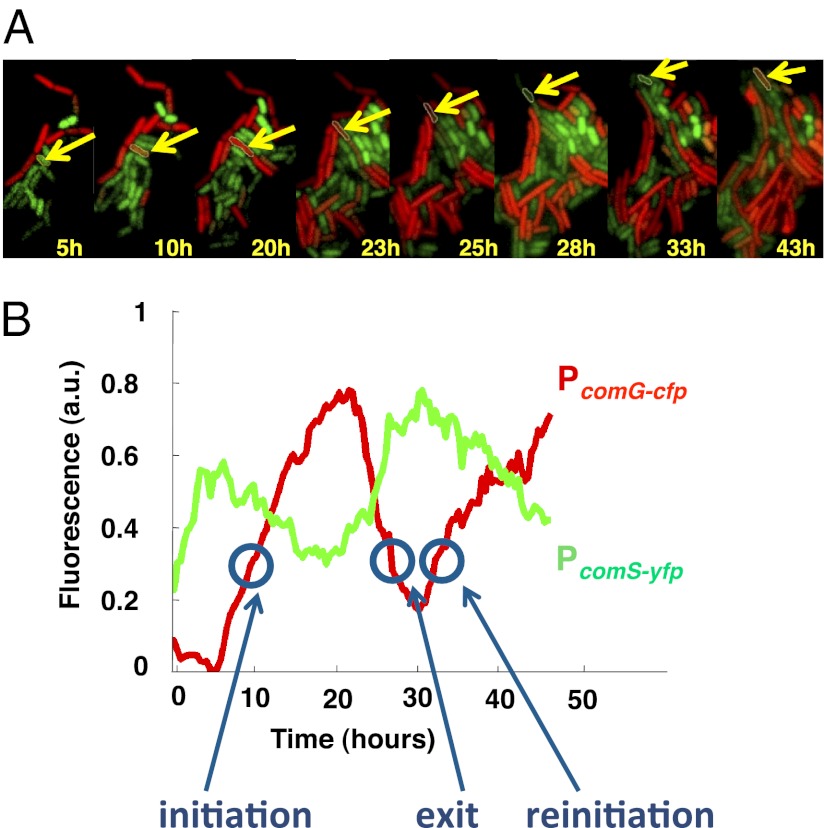
,  . In each panel, the left plot shows a collection of single-cell time traces of CFP levels quantifying PcomG activity, and thus acting as ComK reporter. Color coding corresponds to the one used in Fig. 4, and a particular time trace is highlighted with a thicker line. The right plots show histograms of CFP levels as measured from a typical frame in each movie analyzed, and the Insets display selected snapshots from these movies.
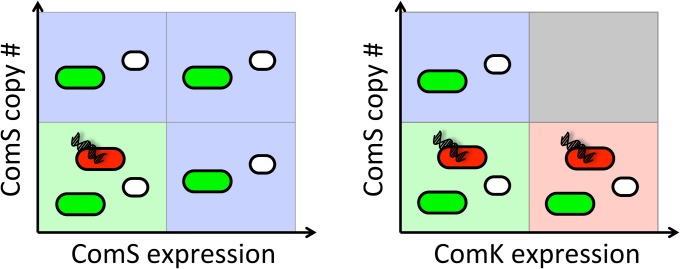
Similar articles
-
Architecture-dependent noise discriminates functionally analogous differentiation circuits.Cell. 2009 Oct 30;139(3):512-22. doi: 10.1016/j.cell.2009.07.046. Epub 2009 Oct 22. Cell. 2009. PMID: 19853288
-
Point-cycle bistability and stochasticity in a regulatory circuit for Bacillus subtilis competence.Math Biosci. 2013 Aug;244(2):135-47. doi: 10.1016/j.mbs.2013.05.002. Epub 2013 May 18. Math Biosci. 2013. PMID: 23693123
-
An excitable gene regulatory circuit induces transient cellular differentiation.Nature. 2006 Mar 23;440(7083):545-50. doi: 10.1038/nature04588. Nature. 2006. PMID: 16554821
-
Stochastic switching to competence.Curr Opin Microbiol. 2008 Dec;11(6):553-9. doi: 10.1016/j.mib.2008.09.020. Epub 2008 Nov 7. Curr Opin Microbiol. 2008. PMID: 18955155 Review.
-
The regulation of genetic competence in Bacillus subtilis.Mol Microbiol. 1991 Jan;5(1):11-8. doi: 10.1111/j.1365-2958.1991.tb01820.x. Mol Microbiol. 1991. PMID: 1901615 Review.
Cited by
-
Evidence for phenotypic bistability resulting from transcriptional interference of bvgAS in Bordetella bronchiseptica.Mol Microbiol. 2013 Nov;90(4):716-33. doi: 10.1111/mmi.12394. Epub 2013 Sep 30. Mol Microbiol. 2013. PMID: 24007341 Free PMC article.
-
Molecular Time Sharing through Dynamic Pulsing in Single Cells.Cell Syst. 2018 Feb 28;6(2):216-229.e15. doi: 10.1016/j.cels.2018.01.011. Epub 2018 Feb 14. Cell Syst. 2018. PMID: 29454936 Free PMC article.
-
Fitness Trade-Offs in Competence Differentiation of Bacillus subtilis.Front Microbiol. 2016 Jun 7;7:888. doi: 10.3389/fmicb.2016.00888. eCollection 2016. Front Microbiol. 2016. PMID: 27375604 Free PMC article.
-
Noise Expands the Response Range of the Bacillus subtilis Competence Circuit.PLoS Comput Biol. 2016 Mar 22;12(3):e1004793. doi: 10.1371/journal.pcbi.1004793. eCollection 2016 Mar. PLoS Comput Biol. 2016. PMID: 27003682 Free PMC article.
-
Secreting and sensing the same molecule allows cells to achieve versatile social behaviors.Science. 2014 Feb 7;343(6171):1242782. doi: 10.1126/science.1242782. Science. 2014. PMID: 24503857 Free PMC article.
References
-
- Silva-Rocha R, de Lorenzo V. Implementing an OR-NOT (ORN) logic gate with components of the SOS regulatory network of Escherichia coli. Mol Biosyst. 2011;7(8):2389–2396. - PubMed
Publication types
MeSH terms
Grants and funding
LinkOut - more resources
Full Text Sources
Other Literature Sources
