

Antidiabetic effect and mode of action of cytopiloyne
- PMID: 23573144
- PMCID: PMC3610345
- DOI: 10.1155/2013/685642
Antidiabetic effect and mode of action of cytopiloyne
Abstract
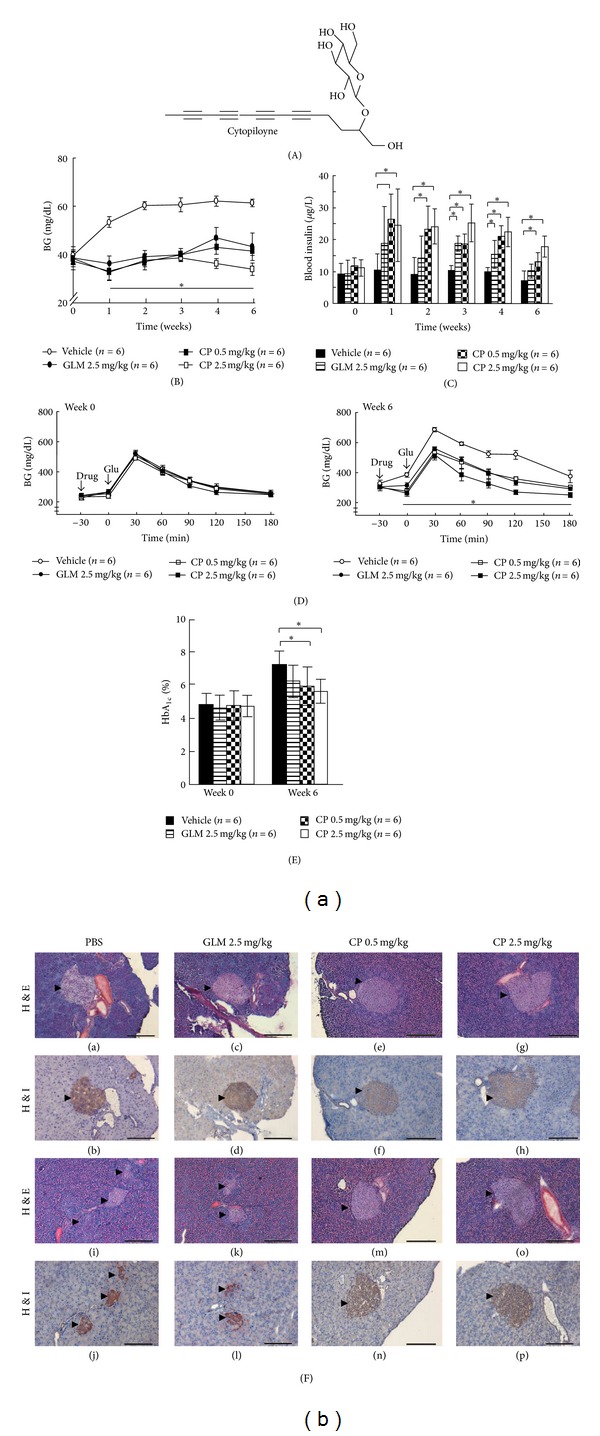
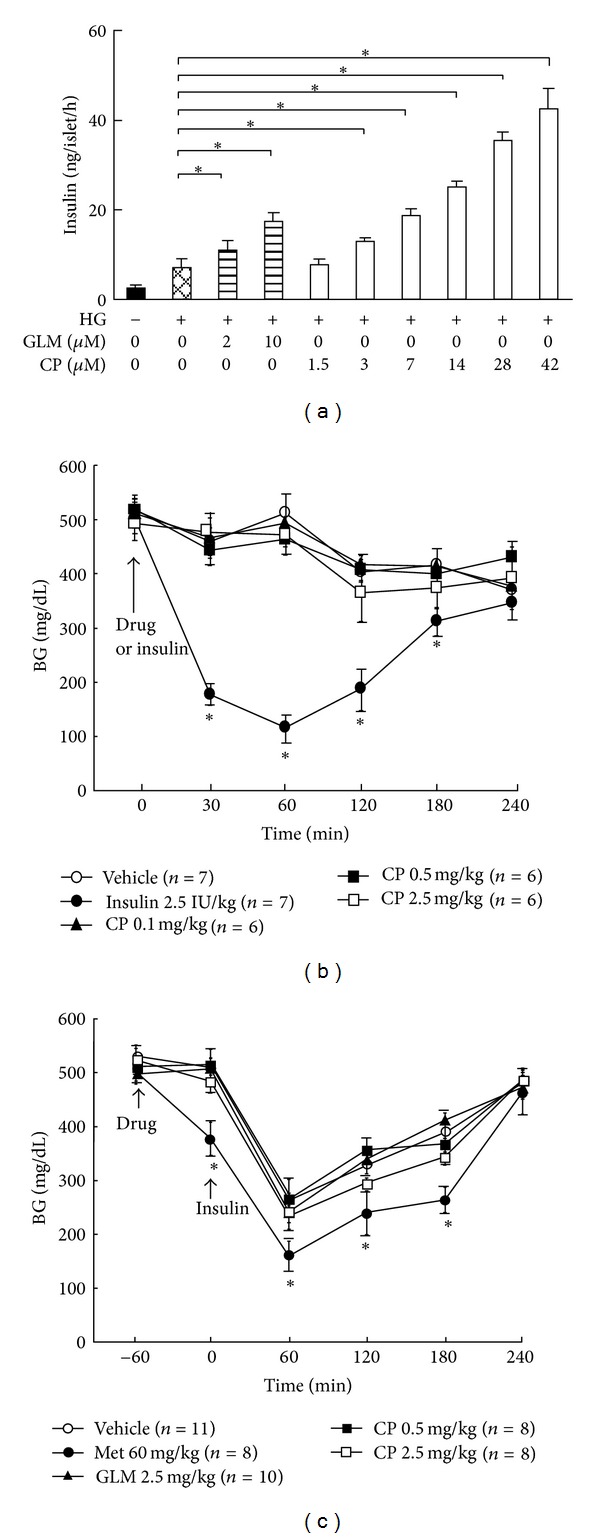
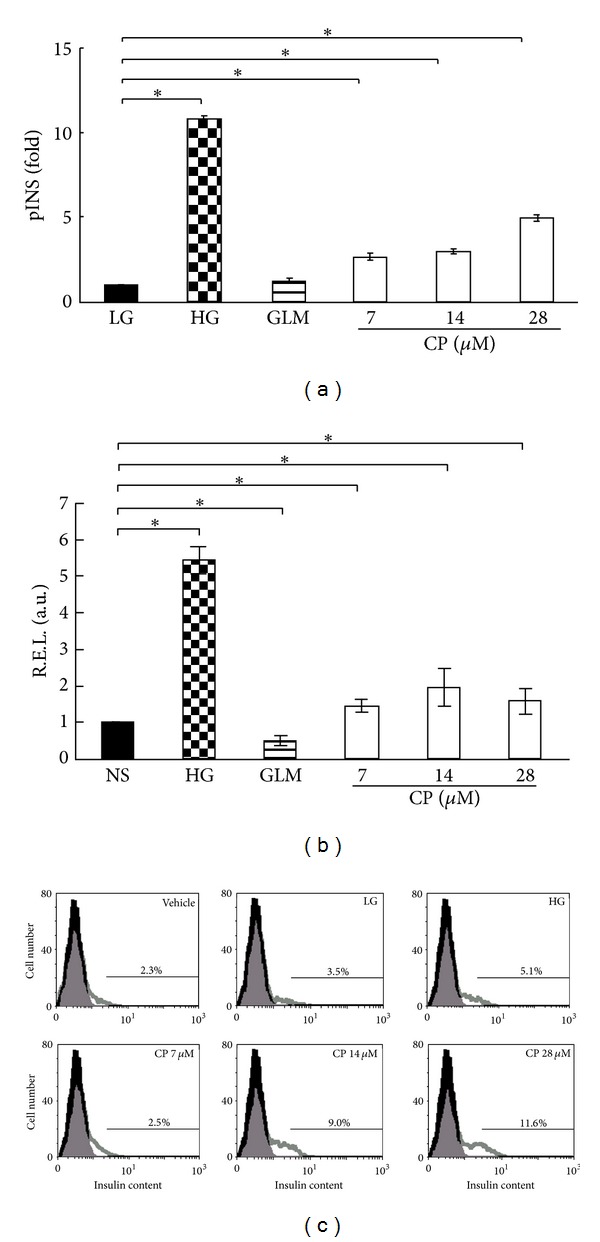
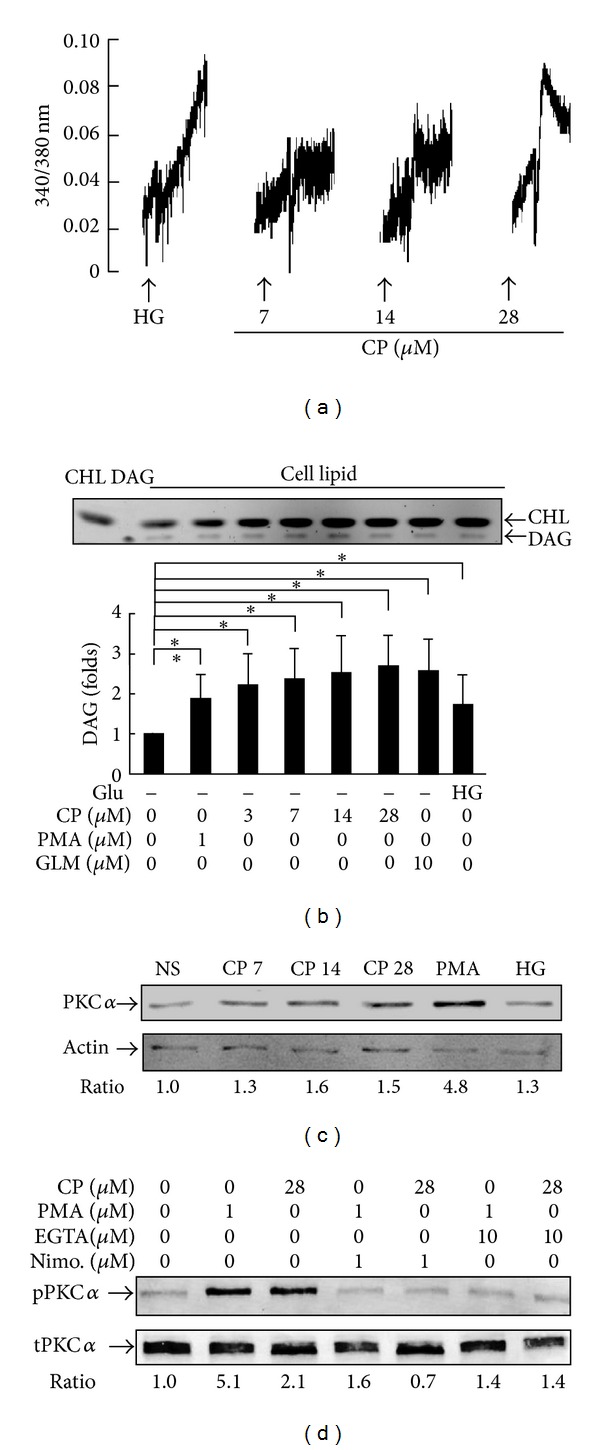
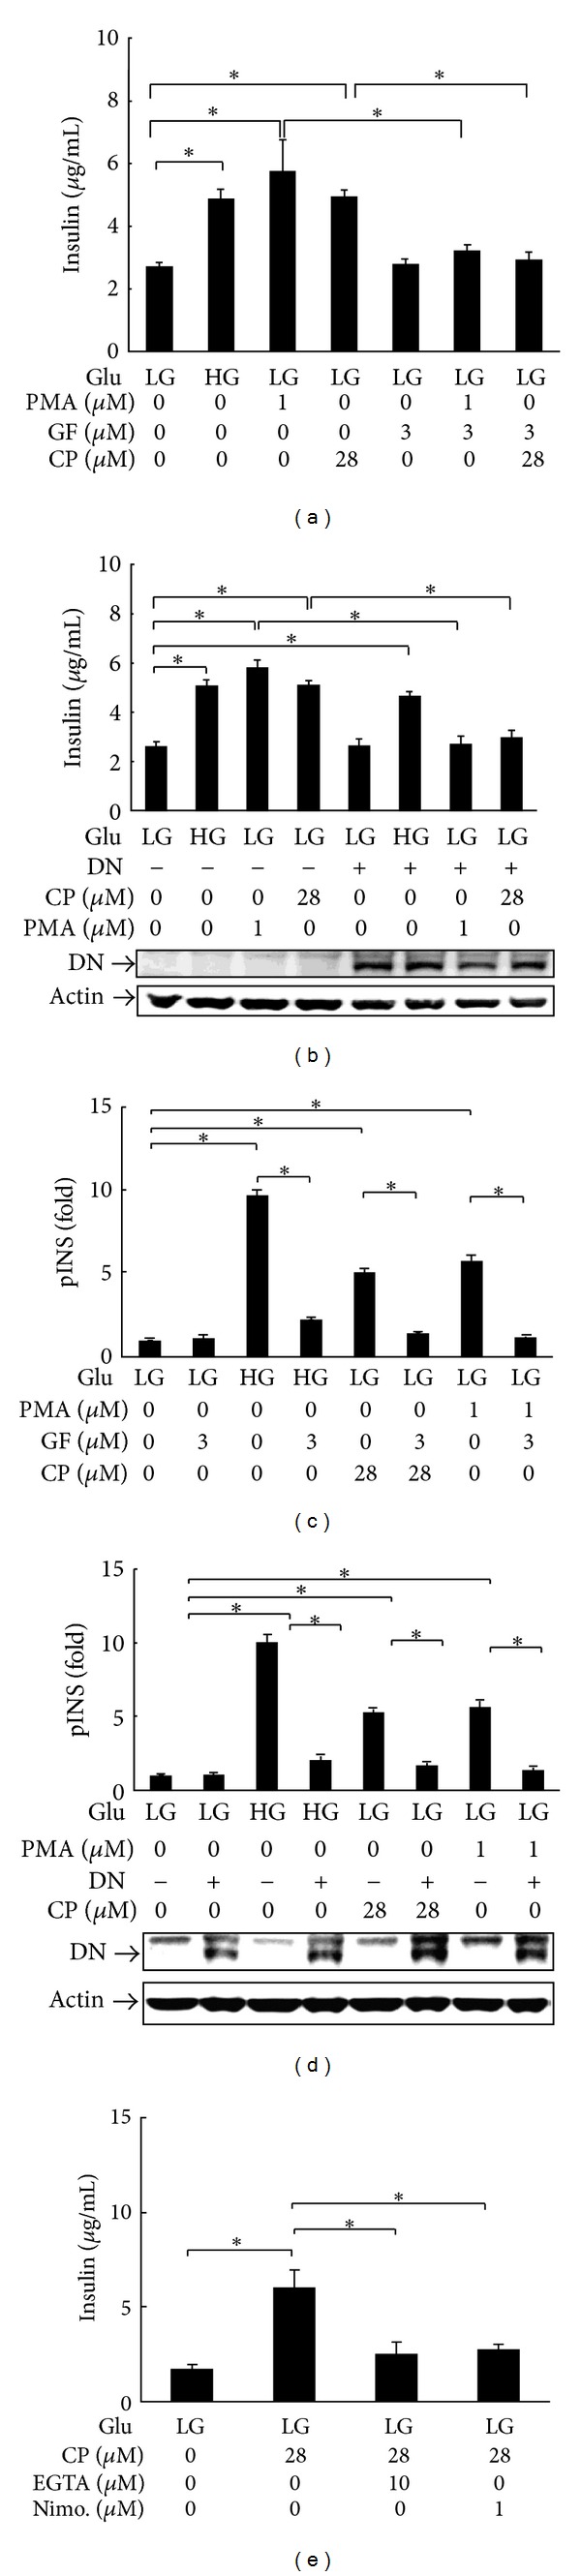
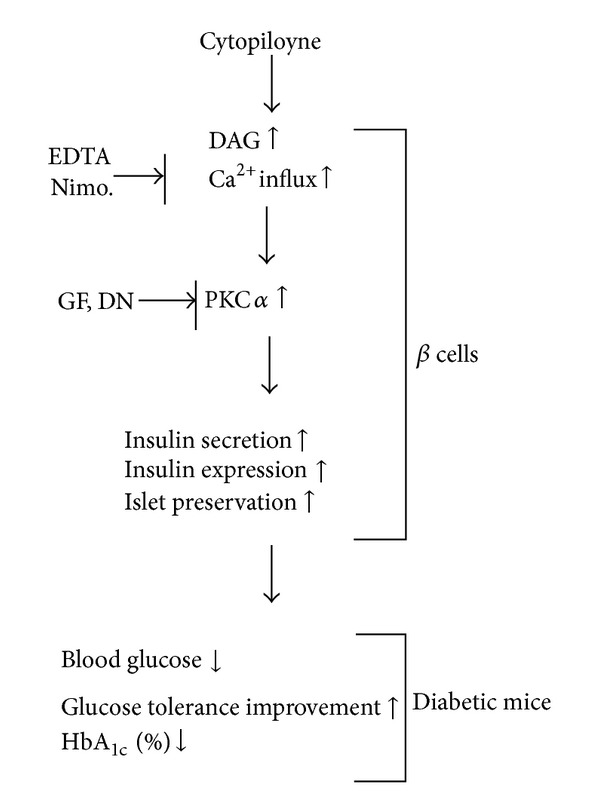
Cytopiloyne was identified as a novel polyacetylenic compound. However, its antidiabetic properties are poorly understood. The aim of the present study was to investigate the anti-diabetic effect and mode of action of cytopiloyne on type 2 diabetes (T2D). We first evaluated the therapeutic effect of cytopiloyne on T2D in db/db mice. We found that one dose of cytopiloyne reduced postprandial glucose levels while increasing blood insulin levels. Accordingly, long-term treatment with cytopiloyne reduced postprandial blood glucose levels, increased blood insulin, improved glucose tolerance, suppressed the level of glycosylated hemoglobin A1c (HbA1c), and protected pancreatic islets in db/db mice. Next, we studied the anti-diabetic mechanism of action of cytopiloyne. We showed that cytopiloyne failed to decrease blood glucose in streptozocin- (STZ-)treated mice whose β cells were already destroyed. Additionally, cytopiloyne dose dependently increased insulin secretion and expression in β cells. The increase of insulin secretion/expression of cytopiloyne was regulated by protein kinase C α (PKC α ) and its activators, calcium, and diacylglycerol (DAG). Overall, our data suggest that cytopiloyne treats T2D via regulation of insulin production involving the calcium/DAG/PKC α cascade in β cells. These data thus identify the molecular mechanism of action of cytopiloyne and prove its therapeutic potential in T2D.
Figures
Similar articles
-
Cytopiloyne, a polyacetylenic glucoside, prevents type 1 diabetes in nonobese diabetic mice.J Immunol. 2007 Jun 1;178(11):6984-93. doi: 10.4049/jimmunol.178.11.6984. J Immunol. 2007. PMID: 17513748
-
Cytopiloyne, a novel polyacetylenic glucoside from Bidens pilosa, functions as a T helper cell modulator.J Ethnopharmacol. 2007 Apr 4;110(3):532-8. doi: 10.1016/j.jep.2006.10.007. Epub 2006 Oct 19. J Ethnopharmacol. 2007. PMID: 17101254
-
Insulinotropic action of 2, 4-dinitroanilino-benzoic acid through the attenuation of pancreatic beta-cell lesions in diabetic rats.Chem Biol Interact. 2017 Aug 1;273:237-244. doi: 10.1016/j.cbi.2017.06.015. Epub 2017 Jun 15. Chem Biol Interact. 2017. PMID: 28625491
-
Diacylglycerol Signaling Pathway in Pancreatic β-Cells: An Essential Role of Diacylglycerol Kinase in the Regulation of Insulin Secretion.Biol Pharm Bull. 2015;38(5):669-73. doi: 10.1248/bpb.b15-00060. Biol Pharm Bull. 2015. PMID: 25947912 Review.
-
Oral antidiabetic agents: current role in type 2 diabetes mellitus.Drugs. 2005;65(3):385-411. doi: 10.2165/00003495-200565030-00005. Drugs. 2005. PMID: 15669880 Review.
Cited by
-
Botanical, Pharmacological, Phytochemical, and Toxicological Aspects of the Antidiabetic Plant Bidens pilosa L.Evid Based Complement Alternat Med. 2014;2014:698617. doi: 10.1155/2014/698617. Epub 2014 Jan 29. Evid Based Complement Alternat Med. 2014. PMID: 24616740 Free PMC article. Review.
-
Bidens pilosa L. (Asteraceae): Botanical Properties, Traditional Uses, Phytochemistry, and Pharmacology.Evid Based Complement Alternat Med. 2013;2013:340215. doi: 10.1155/2013/340215. Epub 2013 Jul 1. Evid Based Complement Alternat Med. 2013. PMID: 23935661 Free PMC article.
-
Antidiabetic Medicinal Plants Used in Democratic Republic of Congo: A Critical Review of Ethnopharmacology and Bioactivity Data.Front Pharmacol. 2021 Oct 27;12:757090. doi: 10.3389/fphar.2021.757090. eCollection 2021. Front Pharmacol. 2021. PMID: 34776975 Free PMC article. Review.
-
Mexican Plants Involved in Glucose Homeostasis and Body Weight Control: Systematic Review.Nutrients. 2023 Apr 25;15(9):2070. doi: 10.3390/nu15092070. Nutrients. 2023. PMID: 37432178 Free PMC article.
-
(-)-Leucophyllone, a Tirucallane Triterpenoid from Cornus walteri, Enhances Insulin Secretion in INS-1 Cells.Plants (Basel). 2021 Feb 24;10(3):431. doi: 10.3390/plants10030431. Plants (Basel). 2021. PMID: 33668330 Free PMC article.
References
-
- Wicksteed B, Alarcon C, Briaud I, Lingohr MK, Rhodes CJ. Glucose-induced translational control of proinsulin biosynthesis is proportional to preproinsulin mRNA levels in islet β-cells but not regulated via a positive feedback of secreted insulin. Journal of Biological Chemistry. 2003;278(43):42080–42090. - PubMed
-
- Newsholme P, Gaudel C, McClenaghan NH. Nutrient regulation of insulin secretion and β-cell functional integrity. Advances in Experimental Medicine and Biology. 2010;654:91–114. - PubMed
-
- Laakso M. Insulin resistance and its impact on the approach to therapy of type 2 diabetes. International Journal of Clinical Practice, Supplement. 2001;(121):8–12. - PubMed
-
- Clements RS, Bell DSH. Complications of diabetes: prevalence, detection, current treatment, and prognosis. American Journal of Medicine. 1985;79(5):2–7. - PubMed
-
- Boyle JP, Engelgau MM, Thompson TJ, et al. Estimating prevalence of type 1 and type 2 diabetes in a population of African Americans with diabetes mellitus. American Journal of Epidemiology. 1999;149(1):55–63. - PubMed
LinkOut - more resources
Full Text Sources
Other Literature Sources
Miscellaneous
