

The metabolic and performance effects of caffeine compared to coffee during endurance exercise
- PMID: 23573201
- PMCID: PMC3616086
- DOI: 10.1371/journal.pone.0059561
The metabolic and performance effects of caffeine compared to coffee during endurance exercise
Abstract
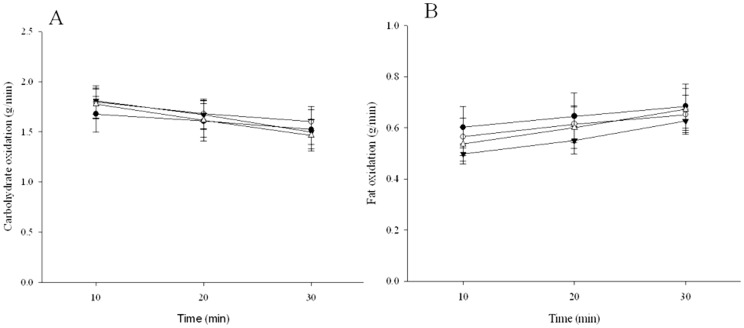
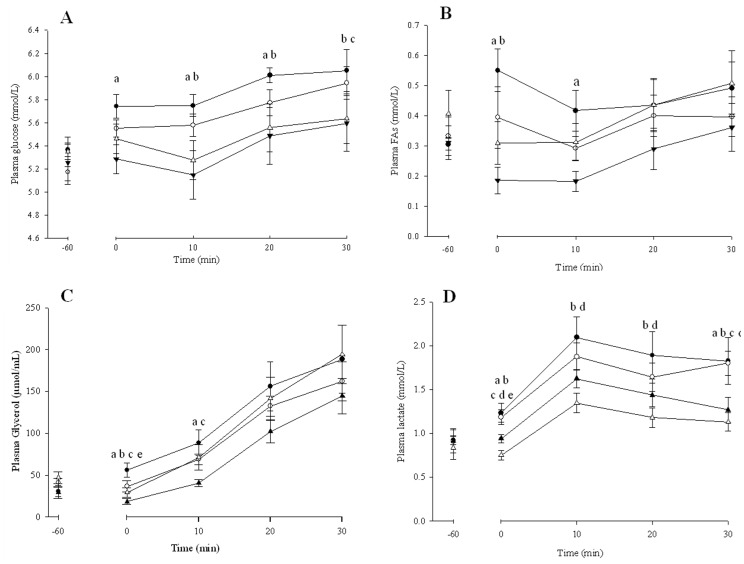
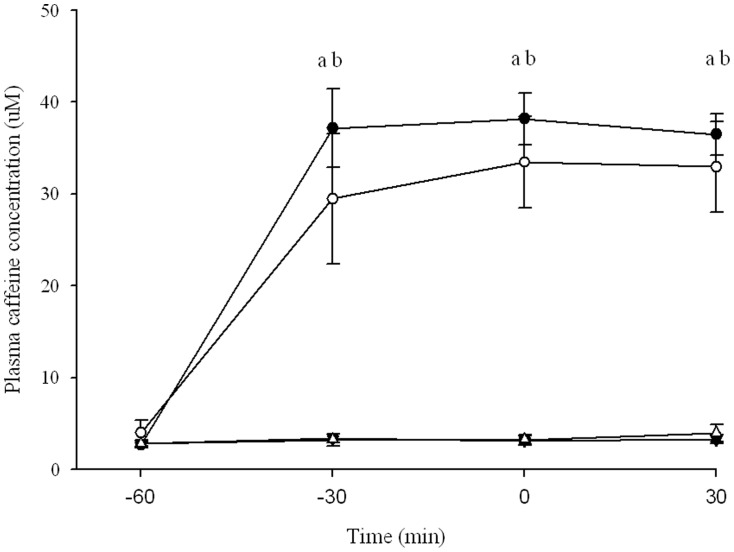
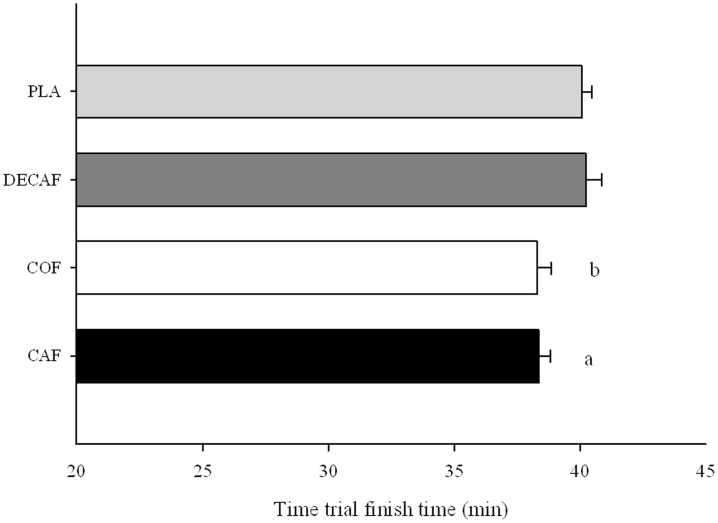
There is consistent evidence supporting the ergogenic effects of caffeine for endurance based exercise. However, whether caffeine ingested through coffee has the same effects is still subject to debate. The primary aim of the study was to investigate the performance enhancing effects of caffeine and coffee using a time trial performance test, while also investigating the metabolic effects of caffeine and coffee. In a single-blind, crossover, randomised counter-balanced study design, eight trained male cyclists/triathletes (Mean ± SD: Age 41 ± 7 y, Height 1.80 ± 0.04 m, Weight 78.9 ± 4.1 kg, VO2 max 58 ± 3 ml • kg(-1) • min(-1)) completed 30 min of steady-state (SS) cycling at approximately 55% VO2max followed by a 45 min energy based target time trial (TT). One hour prior to exercise each athlete consumed drinks consisting of caffeine (5 mg CAF/kg BW), instant coffee (5 mg CAF/kg BW), instant decaffeinated coffee or placebo. The set workloads produced similar relative exercise intensities during the SS for all drinks, with no observed difference in carbohydrate or fat oxidation. Performance times during the TT were significantly faster (~5.0%) for both caffeine and coffee when compared to placebo and decaf (38.35 ± 1.53, 38.27 ± 1.80, 40.23 ± 1.98, 40.31 ± 1.22 min respectively, p<0.05). The significantly faster performance times were similar for both caffeine and coffee. Average power for caffeine and coffee during the TT was significantly greater when compared to placebo and decaf (294 ± 21 W, 291 ± 22 W, 277 ± 14 W, 276 ± 23 W respectively, p<0.05). No significant differences were observed between placebo and decaf during the TT. The present study illustrates that both caffeine (5 mg/kg/BW) and coffee (5 mg/kg/BW) consumed 1 h prior to exercise can improve endurance exercise performance.
Conflict of interest statement
Figures
References
-
- Graham TE, Spriet LL (1995) Metabolic, catecholamine, and exercise performance responses to various doses of caffeine. J Appl Physiol 78: 867–874. - PubMed
-
- Spriet LL, MacLean DA, Dyck DJ, Hultman E, Cederblad G, et al. (1992) Caffeine ingestion and muscle metabolism during prolonged exercise in humans. Am J Physiol 262: E891–898. - PubMed
-
- Jenkins NT, Trilk JL, Singhal A, O'Connor PJ, Cureton KJ (2008) Ergogenic effects of low doses of caffeine on cycling performance. Int J Sport Nutr Exerc Metab 18: 328–342. - PubMed
-
- Irwin C, Desbrow B, Ellis A, O'Keeffe B, Grant G, et al. (2011) Caffeine withdrawal and high-intensity endurance cycling performance. J Sports Sci 29: 509–515. - PubMed
-
- Desbrow B, Biddulph C, Devlin B, Grant GD, Anoopkumar-Dukie S, et al. (2012) The effects of different doses of caffeine on endurance cycling time trial performance. Journal of sports sciences 30: 115–120. - PubMed
Publication types
MeSH terms
Substances
LinkOut - more resources
Full Text Sources
Other Literature Sources
Medical
Miscellaneous
