

Profit (p)-index: the degree to which authors profit from co-authors
- PMID: 23573211
- PMCID: PMC3616037
- DOI: 10.1371/journal.pone.0059814
Profit (p)-index: the degree to which authors profit from co-authors
Abstract
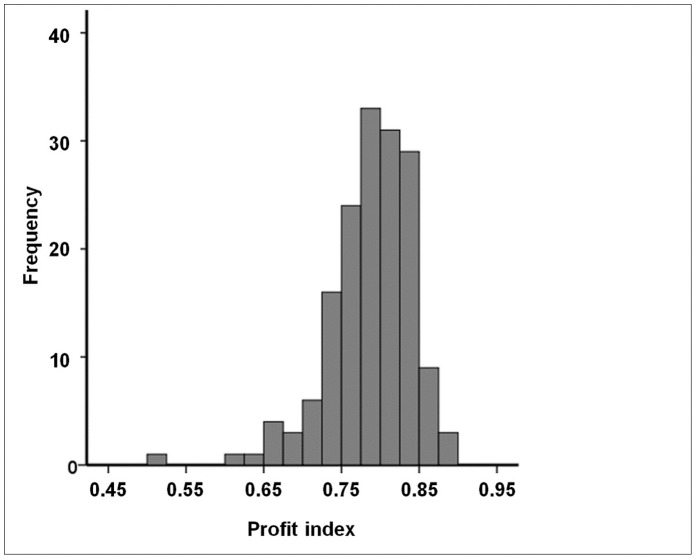
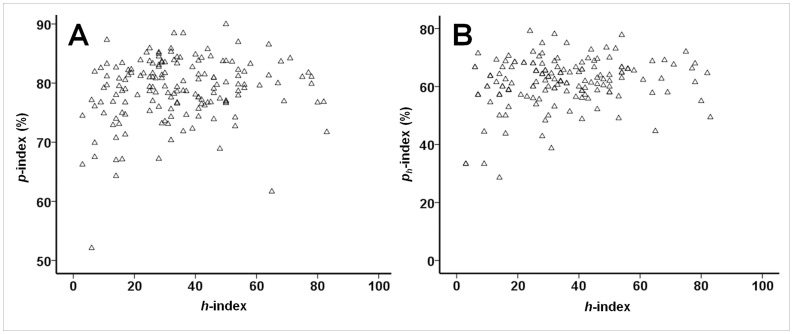
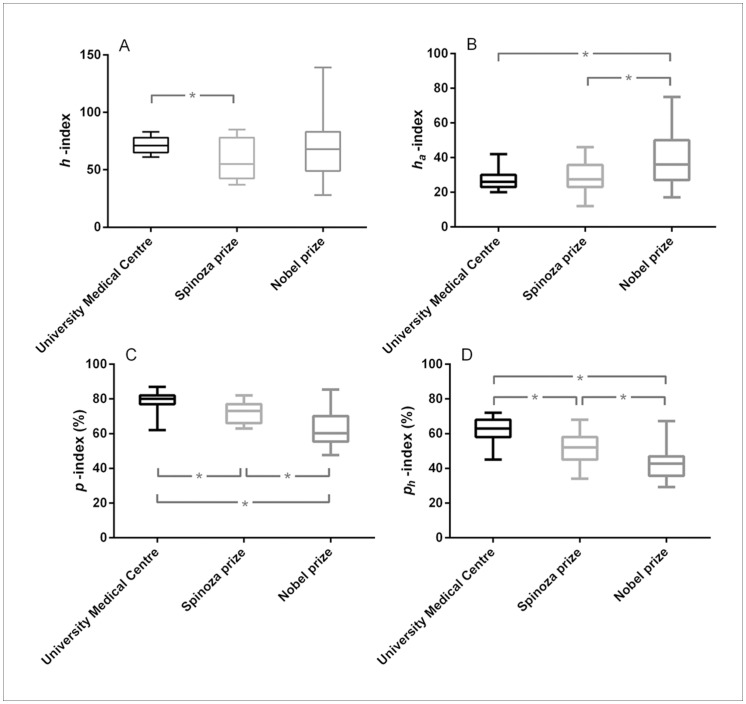
Current metrics for estimating a scientist's academic performance treat the author's publications as if these were solely attributable to the author. However, this approach ignores the substantive contributions of co-authors, leading to misjudgments about the individual's own scientific merits and consequently to misallocation of funding resources and academic positions. This problem is becoming the more urgent in the biomedical field where the number of collaborations is growing rapidly, making it increasingly harder to support the best scientists. Therefore, here we introduce a simple harmonic weighing algorithm for correcting citations and citation-based metrics such as the h-index for co-authorships. This weighing algorithm can account for both the nvumber of co-authors and the sequence of authors on a paper. We then derive a measure called the 'profit (p)-index', which estimates the contribution of co-authors to the work of a given author. By using samples of researchers from a renowned Dutch University hospital, Spinoza Prize laureates (the most prestigious Dutch science award), and Nobel Prize laureates in Physiology or Medicine, we show that the contribution of co-authors to the work of a particular author is generally substantial (i.e., about 80%) and that researchers' relative rankings change materially when adjusted for the contributions of co-authors. Interestingly, although the top University hospital researchers had the highest h-indices, this appeared to be due to their significantly higher p-indices. Importantly, the ranking completely reversed when using the profit adjusted h-indices, with the Nobel laureates having the highest, the Spinoza Prize laureates having an intermediate, and the top University hospital researchers having the lowest profit adjusted h-indices, respectively, suggesting that exceptional researchers are characterized by a relatively high degree of scientific independency/originality. The concepts and methods introduced here may thus provide a more fair impression of a scientist's autonomous academic performance.
Conflict of interest statement
Figures
References
-
- Greene M (2007) The demise of the lone author. Nature 450: 1165. - PubMed
-
- Abbott A, Cyranoski D, Jones N, Maher B, Schiermeier Q, et al. (2010) Metrics: Do metrics matter? Nature 465: 860–862. - PubMed
-
- Bornmann L, Mutz R, Daniel HD (2008) Are there better indices for evaluation purposes than the h index? A comparison of nine different variants of the h index using data from biomedicine. J Am Soc Inf Sci 59: 830–837.
-
- Baerlocher MO, Newton M, Gautam T, Tomlinson G, Detsky AS (2007) The meaning of author order in medical research. J Investig Med 55: 174–180. - PubMed
MeSH terms
LinkOut - more resources
Full Text Sources
Other Literature Sources
Medical
