

MicroRNA-301a mediated regulation of Kv4.2 in diabetes: identification of key modulators
- PMID: 23573265
- PMCID: PMC3616003
- DOI: 10.1371/journal.pone.0060545
MicroRNA-301a mediated regulation of Kv4.2 in diabetes: identification of key modulators
Abstract
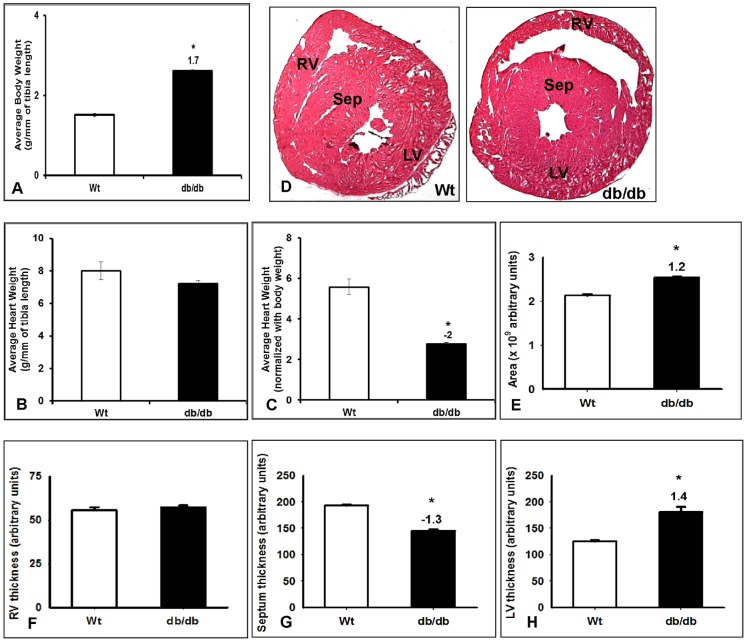
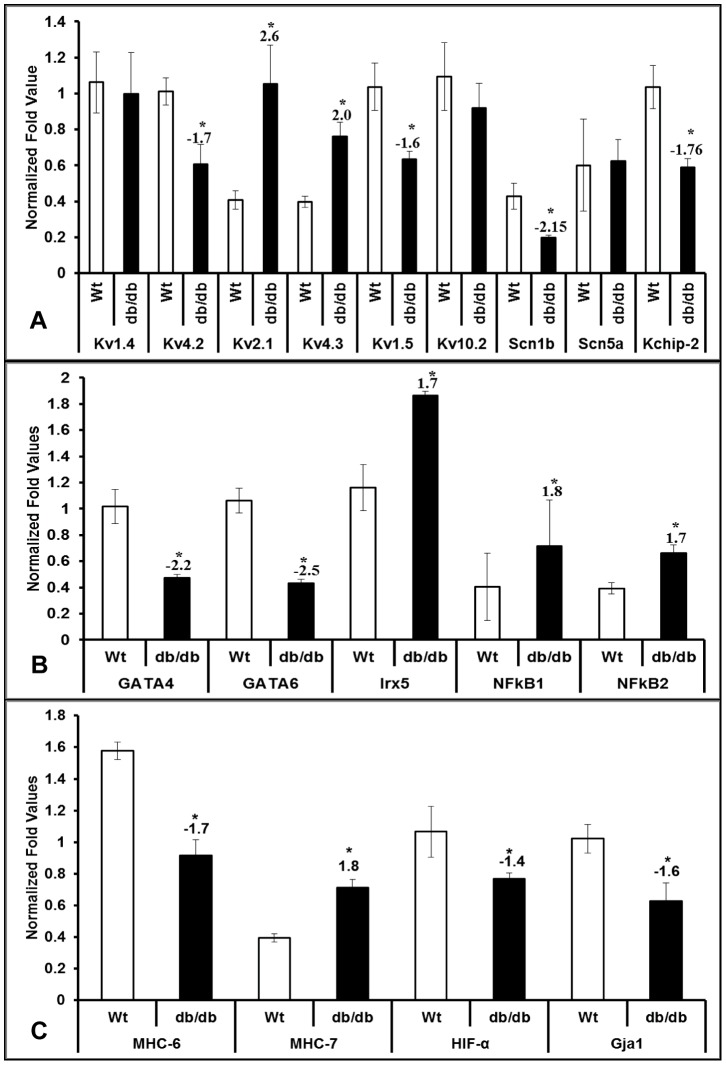
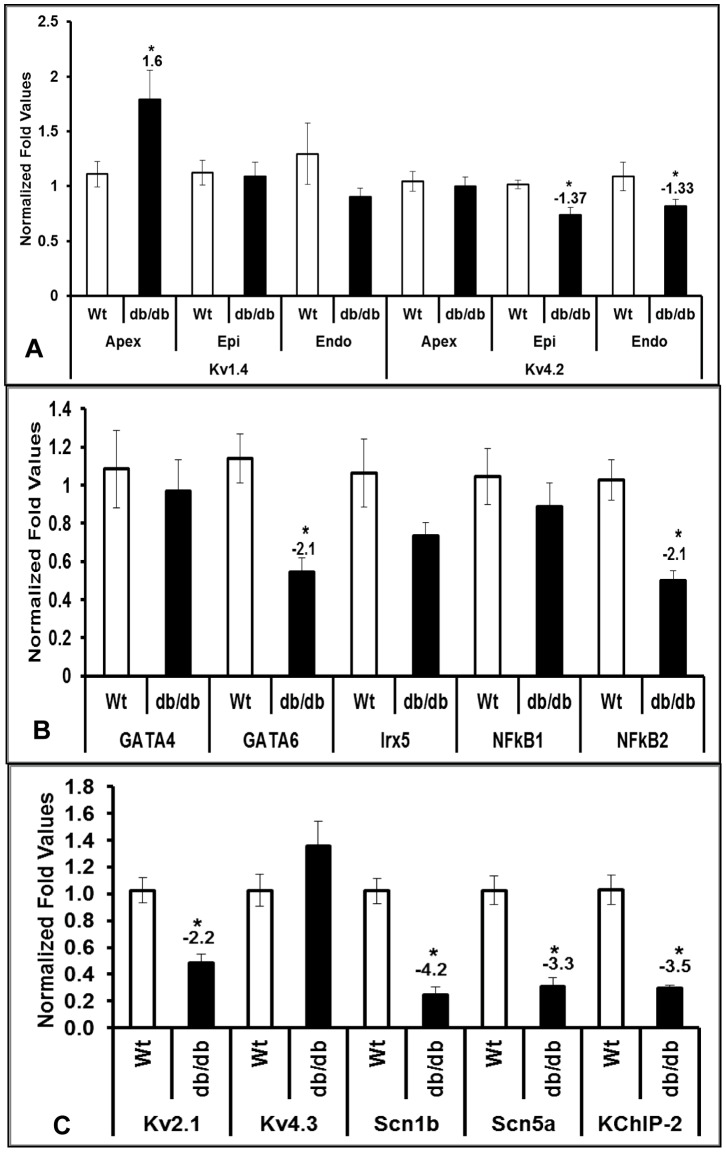
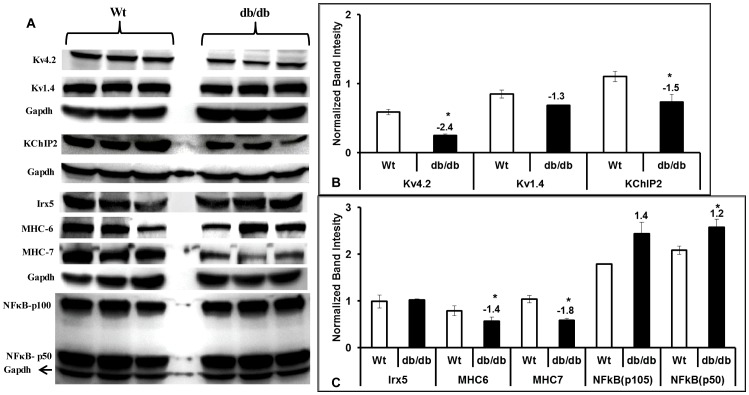
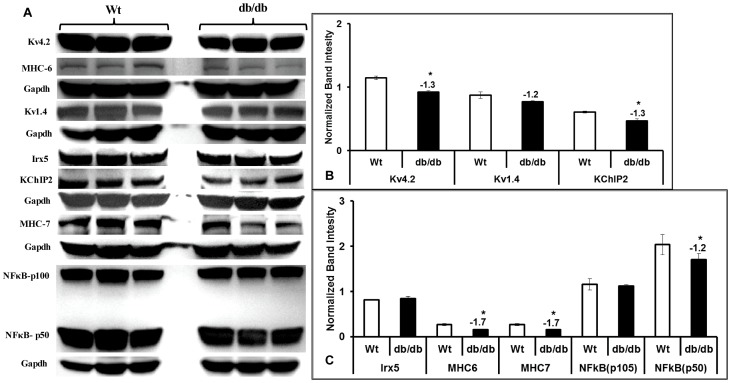
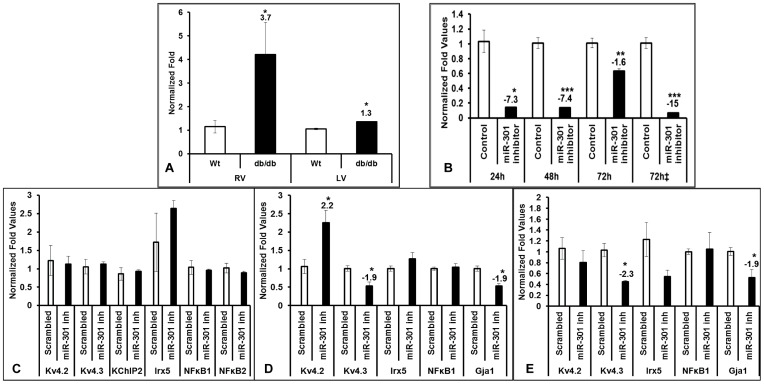
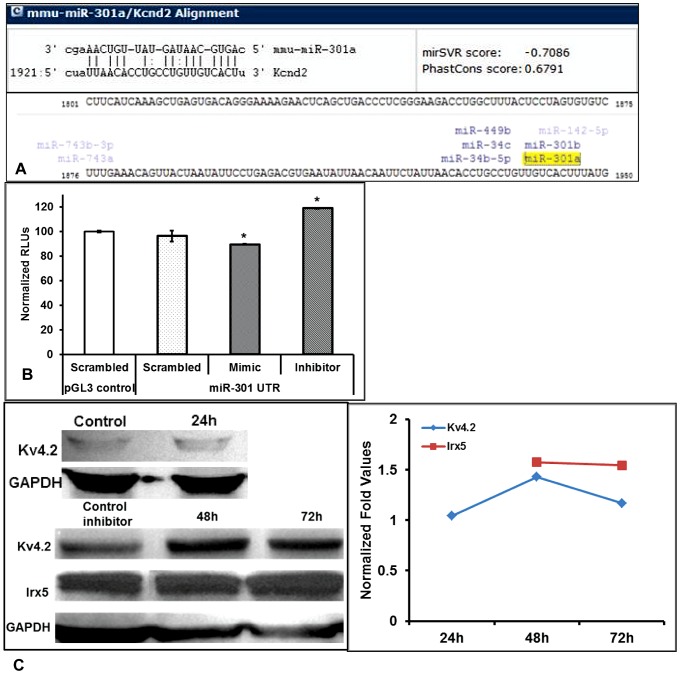
Diabetes is a metabolic disorder that ultimately results in major pathophysiological complications in the cardiovascular system. Diabetics are predisposed to higher incidences of sudden cardiac deaths (SCD). Several studies have associated diabetes as a major underlying risk for heart diseases and its complications. The diabetic heart undergoes remodeling to cope up with the underlying changes, however ultimately fails. In the present study we investigated the changes associated with a key ion channel and transcriptional factors in a diabetic heart model. In the mouse db/db model, we identified key transcriptional regulators and mediators that play important roles in the regulation of ion channel expression. Voltage-gated potassium channel (Kv4.2) is modulated in diabetes and is down regulated. We hypothesized that Kv4.2 expression is altered by potassium channel interacting protein-2 (KChIP2) which is regulated upstream by NFkB and miR-301a. We utilized qRT-PCR analysis and identified the genes that are affected in diabetes in a regional specific manner in the heart. At protein level we identified and validated differential expression of Kv4.2 and KChIP2 along with NFkB in both ventricles of diabetic hearts. In addition, we identified up-regulation of miR-301a in diabetic ventricles. We utilized loss and gain of function approaches to identify and validate the role of miR-301a in regulating Kv4.2. Based on in vivo and in vitro studies we conclude that miR-301a may be a central regulator for the expression of Kv4.2 in diabetes. This miR-301 mediated regulation of Kv4.2 is independent of NFkB and Irx5 and modulates Kv4.2 by direct binding on Kv4.2 3'untranslated region (3'-UTR). Therefore targeting miR-301a may offer new potential for developing therapeutic approaches.
Conflict of interest statement
Figures
Similar articles
-
Type 2 diabetes induces subendocardium-predominant reduction in transient outward K+ current with downregulation of Kv4.2 and KChIP2.Am J Physiol Heart Circ Physiol. 2014 Apr 1;306(7):H1054-65. doi: 10.1152/ajpheart.00414.2013. Epub 2014 Jan 31. Am J Physiol Heart Circ Physiol. 2014. PMID: 24486512
-
MiR-223-3p as a Novel MicroRNA Regulator of Expression of Voltage-Gated K+ Channel Kv4.2 in Acute Myocardial Infarction.Cell Physiol Biochem. 2016;39(1):102-14. doi: 10.1159/000445609. Epub 2016 Jun 20. Cell Physiol Biochem. 2016. PMID: 27322747
-
Prolonged leptin treatment increases transient outward K⁺ current via upregulation of Kv4.2 and Kv4.3 channel subunits in adult rat ventricular myocytes.Pflugers Arch. 2014 May;466(5):903-14. doi: 10.1007/s00424-013-1348-3. Epub 2013 Sep 18. Pflugers Arch. 2014. PMID: 24046152
-
Pharmacological Approaches for the Modulation of the Potassium Channel KV4.x and KChIPs.Int J Mol Sci. 2021 Jan 31;22(3):1419. doi: 10.3390/ijms22031419. Int J Mol Sci. 2021. PMID: 33572566 Free PMC article. Review.
-
The neuronal Kv4 channel complex.Neurochem Res. 2008 Aug;33(8):1558-67. doi: 10.1007/s11064-008-9650-8. Epub 2008 Mar 21. Neurochem Res. 2008. PMID: 18357523 Free PMC article. Review.
Cited by
-
Regulation of Ion Channels by MicroRNAs and the Implication for Epilepsy.Curr Neurol Neurosci Rep. 2018 Jul 25;18(9):60. doi: 10.1007/s11910-018-0870-2. Curr Neurol Neurosci Rep. 2018. PMID: 30046905 Free PMC article. Review.
-
Cardiovascular microRNAs: as modulators and diagnostic biomarkers of diabetic heart disease.Cardiovasc Diabetol. 2014 Feb 14;13:44. doi: 10.1186/1475-2840-13-44. Cardiovasc Diabetol. 2014. PMID: 24528626 Free PMC article. Review.
-
Molecular Mechanisms and Epigenetic Regulation in Diabetic Cardiomyopathy.Front Cardiovasc Med. 2021 Dec 16;8:725532. doi: 10.3389/fcvm.2021.725532. eCollection 2021. Front Cardiovasc Med. 2021. PMID: 34977165 Free PMC article. Review.
-
Plasma Levels of miR-27a, miR-130b, and miR-301a in Polycystic Ovary Syndrome.Int J Mol Cell Med. 2020 Summer;9(3):198-206. doi: 10.22088/IJMCM.BUMS.9.3.198. Epub 2020 Nov 10. Int J Mol Cell Med. 2020. PMID: 33274182 Free PMC article.
-
Glycine confers neuroprotection through microRNA-301a/PTEN signaling.Mol Brain. 2016 May 26;9(1):59. doi: 10.1186/s13041-016-0241-3. Mol Brain. 2016. PMID: 27230112 Free PMC article.
References
-
- Haffner SM, Lehto S, Ronnemaa T, Pyorala K, Laakso M (1998) Mortality from coronary heart disease in subjects with type 2 diabetes and in nondiabetic subjects with and without prior myocardial infarction. N Engl J Med 339: 229–234. - PubMed
-
- Casis O, Gallego M, Iriarte M, Sanchez-Chapula JA (2000) Effects of diabetic cardiomyopathy on regional electrophysiologic characteristics of rat ventricle. Diabetologia 43: 101–109. - PubMed
-
- Li X, Xu Z, Li S, Rozanski GJ (2005) Redox regulation of Ito remodeling in diabetic rat heart. Am J Physiol Heart Circ Physiol 288: H1417–1424. - PubMed
-
- Nishiyama A, Ishii DN, Backx PH, Pulford BE, Birks BR, et al. (2001) Altered K(+) channel gene expression in diabetic rat ventricle: isoform switching between Kv4.2 and Kv1.4. American journal of physiology Heart and circulatory physiology 281: H1800–1807. - PubMed
Publication types
MeSH terms
Substances
Grants and funding
LinkOut - more resources
Full Text Sources
Other Literature Sources
Medical
Miscellaneous
