. 2013;8(4):e60691.
doi: 10.1371/journal.pone.0060691. Epub 2013 Apr 3.

Rasagiline ameliorates olfactory deficits in an alpha-synuclein mouse model of Parkinson's disease

Affiliations

Rasagiline ameliorates olfactory deficits in an alpha-synuclein mouse model of Parkinson's disease

Géraldine H Petit et al. PLoS One. 2013.

Abstract

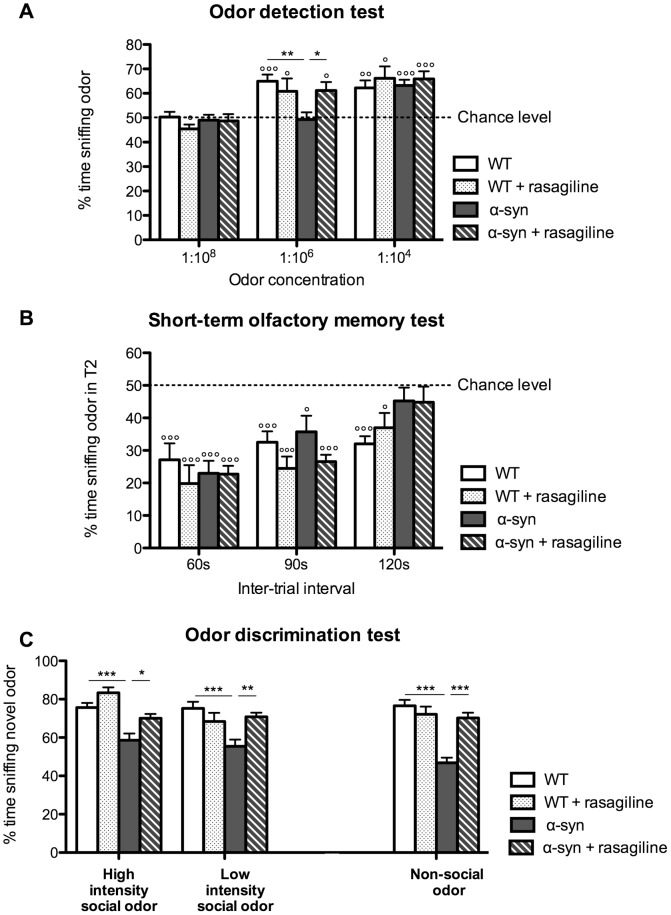
Impaired olfaction is an early pre-motor symptom of Parkinson's disease. The neuropathology underlying olfactory dysfunction in Parkinson's disease is unknown, however α-synuclein accumulation/aggregation and altered neurogenesis might play a role. We characterized olfactory deficits in a transgenic mouse model of Parkinson's disease expressing human wild-type α-synuclein under the control of the mouse α-synuclein promoter. Preliminary clinical observations suggest that rasagiline, a monoamine oxidase-B inhibitor, improves olfaction in Parkinson's disease. We therefore examined whether rasagiline ameliorates olfactory deficits in this Parkinson's disease model and investigated the role of olfactory bulb neurogenesis. α-Synuclein mice were progressively impaired in their ability to detect odors, to discriminate between odors, and exhibited alterations in short-term olfactory memory. Rasagiline treatment rescued odor detection and odor discrimination abilities. However, rasagiline did not affect short-term olfactory memory. Finally, olfactory changes were not coupled to alterations in olfactory bulb neurogenesis. We conclude that rasagiline reverses select olfactory deficits in a transgenic mouse model of Parkinson's disease. The findings correlate with preliminary clinical observations suggesting that rasagiline ameliorates olfactory deficits in Parkinson's disease.


Conflict of interest statement

Competing Interests: Teva Pharmaceutical Industries Ltd and H.Lundbeck A/S, which market rasagiline, contributed to the funding of this study. The authors EB and CFA work for Teva Pharmaceutical Industries Ltd. The authors MH, PK and KF work for H.Lundbeck A/S. PB has received speaking honoraria from and provided consulting services to Teva Pharmaceutical Industries Ltd and H.Lundbeck A/S. Teva Pharmaceutical Industries Ltd. covered the costs of GHP to attend the MDS congress (Toronto 2011). The use of rasagiline for the treatment of olfactory dysfunction is covered by patent number US 2012/0029087 A1. This does not alter the authors' adherence to all the PLOS ONE policies on sharing data and materials.

Figures

Figure 1
Figure 1. Behavioral experiments: design and parameters analyzed.
A. Experimental design of the behavioral study. B. Olfactory- and control tests and the parameters analyzed from these experiments.
Figure 2
Figure 2. Olfactory deficits in the α-syn mouse model of PD.
A-B: Odor detection test. A. Description of the protocol composed of 3 sessions (S). In each 5-min session, mice were exposed to 2 cartridges, one filled with water, the other with increasing odor concentrations from 1∶108 to 1∶104. B. Percentage of time sniffing the odor for the different concentrations. WT mice start detecting the odor at the concentration 1∶106 when percentage of time sniffing the odor is significantly different from the chance level (50%, where mice spent same time sniffing water and odor cartridges) (°°°p<0.001, °°p<0.01, one-sample t-test). α-Syn mice can detect the odor only at 1∶104 (°°°p<0.001, one-sample t-test). At the concentration 1∶106, α-syn mice are significantly impaired compared to WT. N = 10 for each group aged 10–11 months. Statistics: One-sample t-test to compare each value to chance level (50%), (°°°p<0.001, °°p<0.01). Two-way RM ANOVA: odor concentration, p = 0.0001, F(2,36) = 11.96; genotype, p = 0.015, F(1,36) = 7.2; odor concentration×genotype, p = 0.0073, F(2,36) = 5.65; Bonferroni post-hoc (***p<0.001). C-D: Short-term olfactory memory test. C. Description of the protocol composed of 3 sessions (S). Each session consisted of two 5 min-trials (T) where mice are exposed to a novel odor separated by an increasing inter-trial time (ITI) from 60 s to 120 s. D. Percentage of time sniffing the odor during T2 compared to the total time spent sniffing during both trials. WT mice remember the odor during the 2nd exposure for the 3 ITI tested and their percentage of time sniffing the odor during T2 was significantly different from the chance level (50%, where mice spent same time sniffing the odor during T1 and T2) (°°p<0.01, °°°p<0.001, one-sample t-test). By contrast, short-term olfactory memory of α-syn mice was impaired from an ITI of 120 s (p>0.05, one-sample t-test). However, it was significantly different from chance level at 60 s and 90 s (°°°p<0.001 and °p<0.05 respectively, one-sample t-tests). N = 10 for each group aged 10–11 months. Statistics: One-sample t-test to compare each value to chance level (50%), (°°°p<0.001, °°p<0.01, °p<0.05). E-H: Odor discrimination test. E and G: Social odor discrimination test. E. Description of the protocol composed of 6 habituation trials where mice are exposed to a familiar odor (F, odor of the tested mouse); and one odor discrimination trial, where one familiar odor is replaced by a novel odor (N, another mouse's odor). This test was performed with low or high odor intensities (wood blocks impregnated with mouse's odor for 2 or 7 days respectively). Each trial lasted 2 min and was separated by 1 min. G. Percentage of time sniffing novel odor. For both low and high odor intensities, α-syn mice have impaired odor discrimination with the percentage of time sniffing the odor significantly lower than WT. N = 19–21 for each group aged 10–11 months. Statistics: Two-way RM ANOVA: odor intensity, p = 0.55, F(1,38) = 0.37; genotype, p<0.0001, F(1,38) = 27.1; odor intensity×genotype, p = 0.63, F(1,38) = 0.23; Bonferroni post-hoc (***p<0.001). F and H: Non-social odor discrimination test. F. Description of the protocol based on the same principle of the social odor discrimination test but using non-social odors (lemon and lime). In the 8th 2 min-trial, an item discrimination trial was added where the usual cartridge, with the novel odor (lime), was replaced by a novel item (a novel type of cartridge associated with the same novel odor, lime). H. Percentage of time sniffing the novel odor during the odor discrimination trial and percentage of time exploring the novel item in the item discrimination trial. α-syn mice had significantly impaired odor discrimination of the social odor. By contrast, the ability to discriminate the novel item was similar between WT and α-syn mice suggesting that the discrimination deficit is specific to olfaction. Statistics: unpaired t-test, non-social odor discrimination p<0.0001, N = 19–21 for each group aged 10–11 months; item discrimination p = 0.16, N = 10 for each group aged 10-11 months (***p<0.001).
Figure 3
Figure 3. Specificity of the olfactory deficits in α-syn mice.
AB: Odor preference test. A. Description of the protocol. Two cartridges, filled with either lemon or lime are placed in the cage for 5 min. If mice do not have any odor preference they spend a similar time sniffing either cartridge. B. Percentage of time sniffing lemon and lime showing no difference between control and α-syn mice and no difference between lime and lemon odors. N = 19–21 for each group aged 10–11 months. Statistics: two-way ANOVA, odor, p = 0.57, F(1,76) = 0.33; genotype, p = 1.00, F(1,76)≈0; odors×genotype, p = 0.80, F(1,76) = 0.06). C-D Open field test. C. Distance traveled in the open field. No significant difference was observed between WT and α-syn mice. α-syn mice show similar locomotor activity to control mice. N = 10 for each group aged 10–11 months. Statistics: unpaired t-test, p = 0.088. D. Percentage of time spent in different areas. No significant difference between WT and α-syn mice (p>0.05, two-way ANOVA), suggesting each type of mouse exhibited the same level of anxiety. N = 10 for each group aged 10–11 months. Statistics: two-way ANOVA, genotype, p = 1, F(1,54) = 0; areas, p<0.0001, F(1,54) = 165.1; genotype×areas, p = 0.42, F(2,54) = 0.87; Bonferroni post-hoc between WT and α-syn mice, p>0.05). E. Rotarod test. Time spent on the rod was similar between both groups of mice. N = 10 for each group aged 10–11 months. Statistics: unpaired t-test, p = 0.9.
Figure 4
Figure 4. Overexpression of α-synuclein in the olfactory bulb of the α-syn transgenic mice.
Immunostaining of human wild-type α-synuclein in OB of A. WT mice and B-D. α-syn mice aged 12 months. A-B. Scale bars: 500 µm. C-D. High magnification of C. the glomerular layer (Gl) and D. the granule cell layer (GCL). Scale bars: 50 µm. α-Syn mice exhibit high expression of human α-synuclein in the different layers of the OB. α-Synuclein immunoreactivity indicates large profiles (arrows) as well as numerous small α-synuclein immunoreactive puncta (arrow heads).
Figure 5
Figure 5. Olfactory deficits are age-dependent. A-C: Odor detection test.
Description of the protocol consisting of 2 sessions (S). B. Percentage of time spent sniffing the odor at the concentration of 1∶106 (session 1). WT mice aged 3, 11 and 18 months could detect the odor and the percentage of time sniffing the odor was significantly different from the chance level (50%) (°°°p<0.001). On the contrary, α-syn mice are progressively impaired in detecting the odor. Whereas at 3 months transgenic mice spent more time sniffing the odor compared to the chance level (p<0.05), from 11 months of age their scores no longer differed from the chance level (p>0.05) and the percentage of time spent by α-syn mice to sniff the odor is significantly different from WT mice (two way ANOVA). Statistics: One-sample t-tests to compare each value to chance level (50%) (°p<0.05, °°°p<0.001). Two-way ANOVA: age, p = 0.49, F(2,70) = 0.71; genotype, p<0.0001, F(1,70) = 40.21; age×genotype, p = 0.016, F(2,70) = 4.42; Bonferroni post-hoc (***p<0.001). C. Percentage of time spent sniffing the odor at the concentration of 1∶104 (session 2). Both WT and α-syn mice aged 3, 11 and 18 months can detect the odor at the concentration of 1∶104 and their percentage of time sniffing the odor is significantly different from the chance level (°°°p<0.001). Moreover, there is no significant difference between the genotypes (two-way ANOVA p>0.05). Statistics: One-sample t-tests to compare each value to chance level (50%) (°°°p<0.001). Two-way ANOVA: age, p = 0.12, F(2,70) = 2.15; genotype, p = 0.83, F(1,70) = 0.045; age×genotype, p = 0.64, F(2,70) = 0.45. D-F: Short-term olfactory memory test. D. Description of the protocol consisting of 2 sessions (S). E. Session 1 with an inter-trial interval of 60 s. Percentage of time spent sniffing the odor during T2 (trial 2) compared to the total time spent sniffing during both trials. All groups of WT mice aged 3, 11 and 18 months as well as α-syn mice aged 3 and 11 months remember the odor during the 2nd exposure and their percentage of time sniffing the odor during T2 is significantly different from the chance level (50%) (°°°p<0.001). However, from 18 months of age, α-syn mice are impaired in remembering the odor during the 2nd exposure (one-sample t-test, p>0.05) and the percentage of time spent sniffing the odor during T2 is significantly higher compared to 18 month-old WT mice (two-way ANOVA, p<0.001). Statistics: One-sample t-test to compare each value to chance level (50%) (°°°p<0.001). Two-way ANOVA: age, p = 0.0010, F(2,70) = 7.63; genotype, p = 0.0032, F(1,70) = 9.32, age×genotype, p = 0.011, F(2,70) = 4.78; Bonferroni post-hoc (***p<0.001). F. Session 2 with an inter-trial interval of 120 s. Percentage of time spent sniffing the odor during T2 compared to the total time spent sniffing during both trials. All groups of WT mice aged 3, 11 and 18 months remember the odor during the 2nd exposure and their percentage of time spent sniffing the odor during T2 is significantly different from the chance level (one-sample t-tests, °°°p<0.001). On the contrary, α-syn mice aged 3, 11 and 18 months, are all impaired in remembering the odor during the 2nd exposure (one-sample t-tests, p>0.05) and the percentage of time spent sniffing the odor during T2 is significantly higher compared to WT mice of the same age (two way ANOVA, *p<0.05, **p<0.01). Statistics: One-sample t-tests to compare each value to chance level (50%) (°°p<0.01, °°°p<0.001). Two-way ANOVA: age, p = 0.13, F(2,70) = 2.12; genotype, p<0.0001, F(1,70) = 26.86; age×genotype, p = 0.53, F(2,70) = 0.64; Bonferroni post-hoc (*p<0.05, **p<0.01). G-H: Odor discrimination test. G. Description of the protocol consisting of 6 habituation trials and one odor discrimination trial. H. Percentage of time spent sniffing the novel odor. At 3, 11 and 18 months, α-syn mice spend significantly less time compared to age-matched control mice to sniff the novel odor suggesting that they are impaired in their ability to discriminate the novel odor (two-way ANOVA, ***p<0.001). Statistics: Two-way ANOVA: age, p = 0.0028, F(2,70) = 6.42; genotype, p<0.0001, F(1,70) = 77.78; age×genotype, p = 0.077, F(2,70) = 2.66; Bonferroni post-hoc (***p<0.001). For all tests, N = 14 for group aged 3 and 18 months; N = 10 for group aged 11 months.
Figure 6
Figure 6. Rasagiline improved some aspects of olfaction in α-syn mice. A. Effect of rasagiline on odor detection deficit in α-syn mice.
Rasagiline rescued the odor detection deficit in α-syn mice. At a concentration of 1∶106, non-treated α-syn mice do not detect the odor and the percentage of time spent sniffing the odor was close to chance level, whereas rasagiline treated mice were significantly higher than the chance level. Moreover, rasagiline treated mice spent a similar time sniffing the odor compared to control mice. N = 9–10 for each group aged 10–11 months. Statistics: One-sample t-test to compare each value to chance level (50%), (°p<0.05, °°p<0.01, °°°p<0.001). Two-way RM ANOVA: odor concentration, p<0.0001, F(2,66) = 29; group, p = 0.19, F(3,66) = 1.67; odor concentration×group, p = 0.06, F(6,66) = 2.12; Bonferroni post-hoc (*p<0.05, **p<0.001). B. Effect of rasagiline on short-term olfactory memory impairment in α-syn mice. For the 120 s-ITI, percentage of time spent sniffing the odor in T2 was not different from chance level for both α-syn mice groups, treated or not treated with rasagiline. Rasagiline did not improve the short-term olfactory memory in α-syn mice. N =  9–10 for each group aged 10–11 months. Statistics: One-sample t-test compare to chance level (50%), (°p<0.05 and °°°p<0.001). Two-way RM ANOVA: ITI, p<0.0001, F(2,68) = 15.65; group, p = 0.13, F(3,68) = 2.04; ITI×group, p = 0.23, F(6,68) = 1.39; Bonferroni post-hoc. C. Effect of rasagiline on odor discrimination deficit in α-syn mice. Percentage of time spent sniffing the novel odor of α-syn mice was increased by rasagiline treatment for both intensities of the social odor as well as for the non-social odor. α-Syn mice treated with rasagiline were similar to control mice (p>0.05). Rasagiline rescued the odor discrimination deficit of α-syn mice. N =  18–21 for each group aged 10–11 months. Statistics for social odor discrimination: Two-way RM ANOVA, odor intensity, p = 0.032, F(1,74) = 4.78; group, p<0.0001, F(3,74) = 13.3; odor intensity×group, p = 0.034, F(3,74) = 3.04; Bonferroni post-hoc (*p<0.05, **p<0.01, ***p<0.001). Statistics for non-social odor discrimination: one-way ANOVA, p<0.001, F(3,73) = 18.16; Bonferroni post-hoc (***p<0.001).
Figure 7
Figure 7. Neurogenesis changes are not involved in the olfactory deficit of α-syn mice and rasagiline-induced improvement.
A. Quantification of newborn cells in the granule cell layer of the OB. Total number of BrdU positive cells was assessed every sixth section by stereology (counting frame 100 µm×100 µm; counting grid: 300 µm×300 µm). No difference between control and α-syn mice as well as no effect of rasagiline treatment was observed. N = 4-6 for each group aged 12 months. Statistic: one-way ANOVA, p = 0.66, F(3,14) = 0.54. B. BrdU staining in the olfactory bulb of WT and α-syn mice. Scale bars: 100 µm. C. Quantification of newborn neurons in the granule cell layer of the OB. The proportion of BrdU positive cells, which are also NeuN positive, was assessed by confocal microscopy. No difference between control and α-syn mice as well as no effect of rasagiline treatment was observed. On average, we analyzed 100 BrdU-positive cells in each animal, N = 3 mice in each group aged 12 months. Statistic: one-way ANOVA, p = 0.61, F(3,8) = 0.65. D. NeuN (green) and BrdU (red) double staining in the OB. Examples of NeuN-positive/BrdU positive-cells observed in WT and α-syn mice. Scale bars: 55.5 µm.

Similar articles

Cited by

References

    1. Chaudhuri KR, Naidu Y (2008) Early Parkinson's disease and non-motor issues. J Neurol 255: S33–38. - PubMed
    1. Kranick SM, Duda JE (2008) Olfactory dysfunction in Parkinson's disease. Neurosignals 16: 35–40. - PubMed
    1. Haehner A, Boesveldt S, Berendse HW, Mackay-Sim A, Fleischmann J, et al. (2009) Prevalence of smell loss in Parkinson's disease--a multicenter study. Parkinsonism Relat Disord 15: 490–494. - PubMed
    1. Ross GW, Petrovitch H, Abbott RD, Tanner CM, Popper J, et al. (2008) Association of olfactory dysfunction with risk for future Parkinson's disease. Ann Neurol 63: 167–173. - PubMed
    1. Haehner A, Hummel T, Reichmann H (2010) Olfactory Function in Parkinson's Disease. Eur Neurol Rev 5: 26–29.

Publication types