Generation of mast cells from mouse fetus: analysis of differentiation and functionality, and transcriptome profiling using next generation sequencer
- PMID: 23573287
- PMCID: PMC3616098
- DOI: 10.1371/journal.pone.0060837
Generation of mast cells from mouse fetus: analysis of differentiation and functionality, and transcriptome profiling using next generation sequencer
Abstract
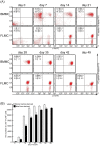
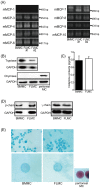
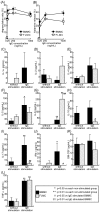
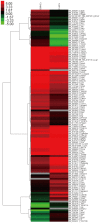
While gene knockout technology can reveal the roles of proteins in cellular functions, including in mast cells, fetal death due to gene manipulation frequently interrupts experimental analysis. We generated mast cells from mouse fetal liver (FLMC), and compared the fundamental functions of FLMC with those of bone marrow-derived mouse mast cells (BMMC). Under electron microscopy, numerous small and electron-dense granules were observed in FLMC. In FLMC, the expression levels of a subunit of the FcεRI receptor and degranulation by IgE cross-linking were comparable with BMMC. By flow cytometry we observed surface expression of c-Kit prior to that of FcεRI on FLMC, although on BMMC the expression of c-Kit came after FcεRI. The surface expression levels of Sca-1 and c-Kit, a marker of putative mast cell precursors, were slightly different between bone marrow cells and fetal liver cells, suggesting that differentiation stage or cell type are not necessarily equivalent between both lineages. Moreover, this indicates that phenotypically similar mast cells may not have undergone an identical process of differentiation. By comprehensive analysis using the next generation sequencer, the same frequency of gene expression was observed for 98.6% of all transcripts in both cell types. These results indicate that FLMC could represent a new and useful tool for exploring mast cell differentiation, and may help to elucidate the roles of individual proteins in the function of mast cells where gene manipulation can induce embryonic lethality in the mid to late stages of pregnancy.
Conflict of interest statement
Figures


Similar articles
-
Comparative Analysis of Bone Marrow-derived Mast Cell Differentiation in C57BL/6 and BALB/c Mice.Immunol Invest. 2019 Apr;48(3):303-320. doi: 10.1080/08820139.2018.1523924. Epub 2018 Oct 18. Immunol Invest. 2019. PMID: 30335529
-
Fetal Tissue-Derived Mast Cells (MC) as Experimental Surrogate for In Vivo Connective Tissue MC.Cells. 2022 Mar 8;11(6):928. doi: 10.3390/cells11060928. Cells. 2022. PMID: 35326379 Free PMC article.
-
Cytokine mRNA are preferentially increased relative to secretory granule protein mRNA in mouse bone marrow-derived mast cells that have undergone IgE-mediated activation and degranulation.J Immunol. 1991 Mar 1;146(5):1527-33. J Immunol. 1991. PMID: 1993842
-
TLR3-, TLR7-, and TLR9-mediated production of proinflammatory cytokines and chemokines from murine connective tissue type skin-derived mast cells but not from bone marrow-derived mast cells.J Immunol. 2004 Jul 1;173(1):531-41. doi: 10.4049/jimmunol.173.1.531. J Immunol. 2004. PMID: 15210814
-
Defining mast cell differentiation and heterogeneity through single-cell transcriptomics analysis.J Allergy Clin Immunol. 2022 Oct;150(4):739-747. doi: 10.1016/j.jaci.2022.08.011. J Allergy Clin Immunol. 2022. PMID: 36205448 Free PMC article. Review.
Cited by
-
Type I Interferon α/β Receptor-Mediated Signaling Negatively Regulates Antiviral Cytokine Responses in Murine Bone-Marrow-Derived Mast Cells and Protects the Cells from Virus-Induced Cell Death.Int J Mol Sci. 2020 Nov 27;21(23):9041. doi: 10.3390/ijms21239041. Int J Mol Sci. 2020. PMID: 33261178 Free PMC article.
-
The role of Lin28b in myeloid and mast cell differentiation and mast cell malignancy.Leukemia. 2015 Jun;29(6):1320-30. doi: 10.1038/leu.2015.19. Epub 2015 Feb 6. Leukemia. 2015. PMID: 25655194 Free PMC article.
-
Salt-inducible kinases are required for the IL-33-dependent secretion of cytokines and chemokines in mast cells.J Biol Chem. 2021 Jan-Jun;296:100428. doi: 10.1016/j.jbc.2021.100428. Epub 2021 Feb 16. J Biol Chem. 2021. PMID: 33600797 Free PMC article.
References
-
- Kulka M (2009) The potential of natural products as effective treatments for allergic inflammation: implications for allergic rhinitis. Curr Top Med Chem 9: 1611–1624. - PubMed
-
- Kubo Y, Fukuishi N, Yoshioka M, Kawasoe Y, Iriguchi S, et al. (2007) Bacterial components regulate the expression of Toll-like receptor 4 on human mast cells. Inflamm Res 56: 70–75. - PubMed
-
- Fukuishi N, Metcalfe DD, Kulka M (2004) Sounding the alarm in infection; Mast cell counter-attack. J World Allefgy Organization 16: 70–74.
-
- Yoshioka M, Fukuishi N, Iriguchi S, Ohsaki K, Yamanobe H, et al. (2007) Lipoteichoic acid downregulates FcepsilonRI expression on human mast cells through Toll-like receptor 2. J Allergy Clin Immunol 120: 452–461. - PubMed
Publication types
MeSH terms
Substances
LinkOut - more resources
Full Text Sources
Other Literature Sources
Medical
Research Materials

