. 2013 Apr 11;368(15):1388-97.
doi: 10.1056/NEJMoa1204471.

An fMRI-based neurologic signature of physical pain

Affiliations

An fMRI-based neurologic signature of physical pain

Tor D Wager et al. N Engl J Med. .

Abstract

Background: Persistent pain is measured by means of self-report, the sole reliance on which hampers diagnosis and treatment. Functional magnetic resonance imaging (fMRI) holds promise for identifying objective measures of pain, but brain measures that are sensitive and specific to physical pain have not yet been identified.

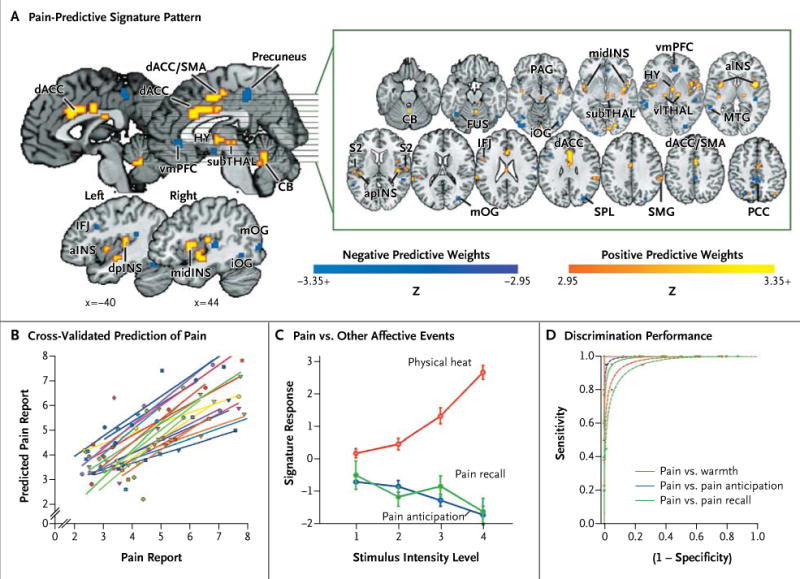
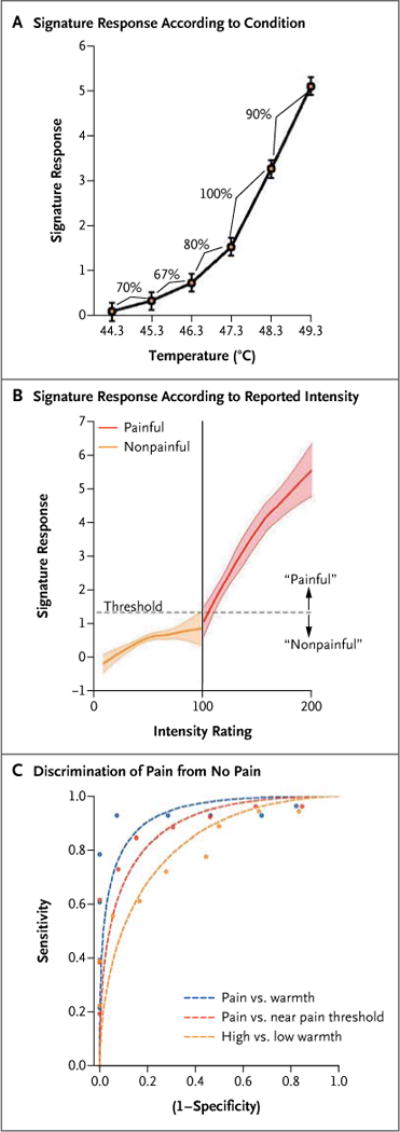
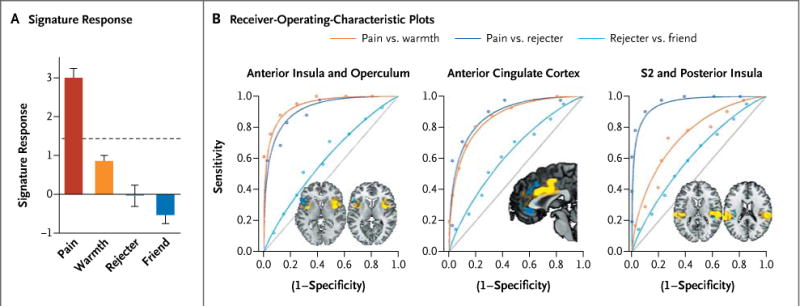
Methods: In four studies involving a total of 114 participants, we developed an fMRI-based measure that predicts pain intensity at the level of the individual person. In study 1, we used machine-learning analyses to identify a pattern of fMRI activity across brain regions--a neurologic signature--that was associated with heat-induced pain. The pattern included the thalamus, the posterior and anterior insulae, the secondary somatosensory cortex, the anterior cingulate cortex, the periaqueductal gray matter, and other regions. In study 2, we tested the sensitivity and specificity of the signature to pain versus warmth in a new sample. In study 3, we assessed specificity relative to social pain, which activates many of the same brain regions as physical pain. In study 4, we assessed the responsiveness of the measure to the analgesic agent remifentanil.

Results: In study 1, the neurologic signature showed sensitivity and specificity of 94% or more (95% confidence interval [CI], 89 to 98) in discriminating painful heat from nonpainful warmth, pain anticipation, and pain recall. In study 2, the signature discriminated between painful heat and nonpainful warmth with 93% sensitivity and specificity (95% CI, 84 to 100). In study 3, it discriminated between physical pain and social pain with 85% sensitivity (95% CI, 76 to 94) and 73% specificity (95% CI, 61 to 84) and with 95% sensitivity and specificity in a forced-choice test of which of two conditions was more painful. In study 4, the strength of the signature response was substantially reduced when remifentanil was administered.

Conclusions: It is possible to use fMRI to assess pain elicited by noxious heat in healthy persons. Future studies are needed to assess whether the signature predicts clinical pain. (Funded by the National Institute on Drug Abuse and others.).


Figures

Figure 1
Figure 1. Prediction of Physical Pain on the Basis of Normative Data from Other Participants in Study 1
Panel A shows the signature map, consisting of voxels in which activity reliably predicted pain. The map shows weights that exceed a threshold (a false discovery rate of q < 0.05) for display only; all weights were used in prediction. ACC denotes anterior cingulate cortex, CB cerebellum, FUS fusiform, HY hypothalamus, IFJ inferior frontal junction, INS insula, MTG middle temporal gyrus, OG occipital gyrus, PAG periaqueductal gray matter, PCC posterior cingulate cortex, PFC prefrontal cortex, S2 secondary somatosensory cortex, SMA supplementary motor area, SMG supramarginal gyrus, SPL superior parietal lobule, TG temporal gyrus, and THAL thalamus. Direction is indicated with preceding lowercase letters as follows: a denotes anterior, d dorsal, i inferior, l lateral, m middle, mid mid-insula, p posterior, and v ventral. Panel B shows reported pain versus cross-validated predicted pain. Each colored line or symbol represents an individual participant. Panel C shows the signature response versus the pain intensity for heat, pain-anticipation, and pain-recall conditions. Signatureresponse values were calculated by taking the dot product of the signature-pattern weights and parameter estimates from a standard, single-participant general linear model, with regressors for each condition. The estimates shown are derived from cross-validation, so that signature weights and test data are independent. I bars indicate standard errors. The receiver-operating-characteristic plots in Panel D show the tradeoff between specificity and sensitivity. Lines are fitted curves, assuming gaussian signal distributions. The test of pain versus no pain and the forced-choice test are shown by dashed lines and solid lines, respectively. Performance on the forced-choice test was at 100% for all conditions; thus, the lines are overlapping.
Figure 2
Figure 2. Application of the Neurologic Signature in Study 2
Panel A shows the signature response across the temperatures used in study 2. The signature response was defined as the dot product of the signature-pattern weights from study 1 and the activation maps for each temperature within each individual participant. I bars show the standard error for the within-participant data. The signature response increased with increasing temperature, as did the level of reported pain. Percentages indicate the sensitivity and specificity for adjacent temperatures in the forced-choice classification. Sensitivity and specificity are equivalent for the forced-choice test and reflect the proportion of participants for whom the prediction based on the signature response was correct. Panel B shows the signature response as a function of reported intensity, for conditions rated as warm (nonpainful; orange) and those rated as painful (red). Loess smoothing was used to visualize the relationship; shaded areas show bootstrapped standard errors. The vertical line (at 100) divides conditions explicitly rated as painful from those rated as nonpainful, and the dashed horizontal line (at 1.32) is the classification threshold that maximizes the classification accuracy for painful versus nonpainful conditions. Panel C shows the discrimination performance for comparisons of pain and no pain. Performance (circles) was generally better than predicted by the gaussian model (dashed lines), suggesting a super-gaussian distribution of the signature response. Discrimination in the forced-choice test showed 100% sensitivity and specificity in all comparisons (data not shown).
Figure 3
Figure 3. Application of the Neurologic Signature to Physical and Social Pain Stimuli in Study 3
Panel A shows the signature response in each condition. The dashed horizontal line shows the threshold derived from the classification of pain versus warmth in study 1. I bars indicate standard errors. Panel B shows the receiver-operating-characteristic plots for the forced-choice test, assessed only from the pattern within a single region of interest. A physical-pain signature would ideally show high sensitivity and specificity for pain versus warmth (orange line) and pain versus rejecter (dark blue line) but chance performance for rejecter versus friend (light blue line). The brain images (insets) show the positive (yellow) and negative (blue) signature weights in each region of interest, with the magnitude of the weights represented by the intensity of the color.

Comment in

  • Pain, heat, and emotion with functional MRI.
    Jaillard A, Ropper AH. Jaillard A, et al. N Engl J Med. 2013 Apr 11;368(15):1447-9. doi: 10.1056/NEJMe1213074. N Engl J Med. 2013. PMID: 23574124 No abstract available.
  • A brain signature for acute pain.
    Apkarian AV. Apkarian AV. Trends Cogn Sci. 2013 Jul;17(7):309-10. doi: 10.1016/j.tics.2013.05.001. Epub 2013 Jun 5. Trends Cogn Sci. 2013. PMID: 23747083 Free PMC article.
  • Can pain be measured objectively?
    Lu Y, Klein GT, Wang MY. Lu Y, et al. Neurosurgery. 2013 Aug;73(2):N24-5. doi: 10.1227/01.neu.0000432627.18847.8e. Neurosurgery. 2013. PMID: 23867275 No abstract available.

References

    1. Institute of Medicine. Relieving pain in America: a blueprint for transforming prevention, care, education, and research. Washington, DC: National Academies Press; 2011. - PubMed
    1. Flor H, Turk D. Chronic pain: an integrated biobehavioral approach. Seattle: IASP Press; 2011.
    1. Wager TD, Fields H. Placebo analgesia. In: McMahon SB, Koltzenburg M, editors. Wall and Melzack’s textbook of pain. Oxford, United Kingdom: Churchill Livingstone; (in press)
    1. Hastie T, Tibshirani R, Friedman JH. The elements of statistical learning: data mining, inference, and prediction. 2. New York: Springer; 2009.
    1. Mitchell T. Does machine learning really work? AI Magazine. 1997;18:11.

Publication types

MeSH terms