. 2013 Apr 10:6:13.
doi: 10.1186/1755-8794-6-13.

Analysis of a gene co-expression network establishes robust association between Col5a2 and ischemic heart disease

Affiliations

Analysis of a gene co-expression network establishes robust association between Col5a2 and ischemic heart disease

Francisco Azuaje et al. BMC Med Genomics. .

Abstract

Background: This study aims to expand knowledge of the complex process of myocardial infarction (MI) through the application of a systems-based approach.

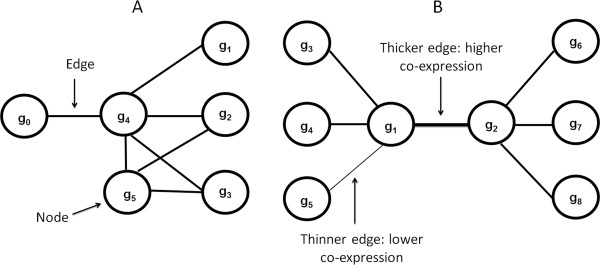
Methods: We generated a gene co-expression network from microarray data originating from a mouse model of MI. We characterized it on the basis of connectivity patterns and independent biological information. The potential clinical novelty and relevance of top predictions were assessed in the context of disease classification models. Models were validated using independent gene expression data from mouse and human samples.

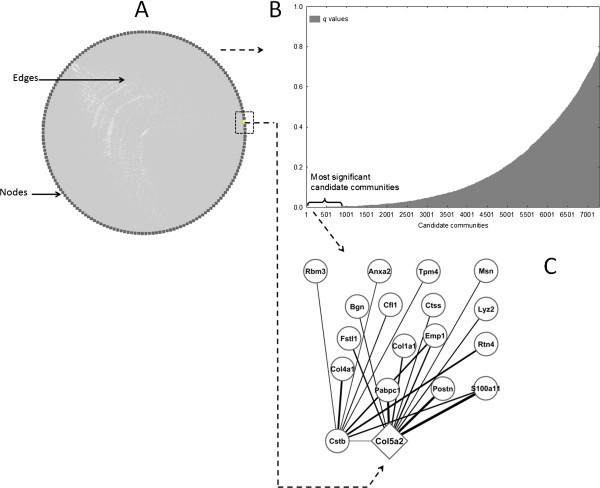
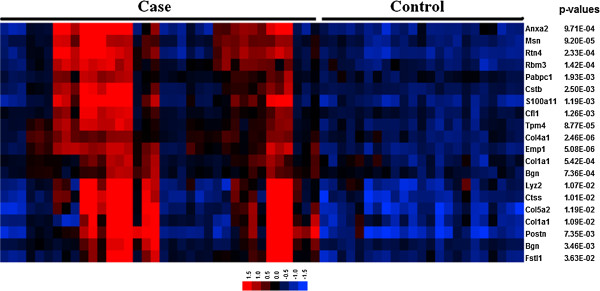
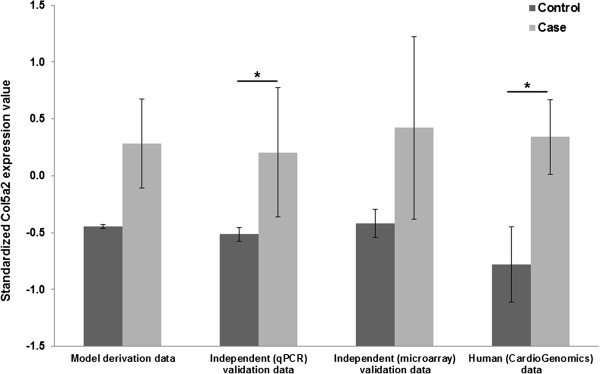
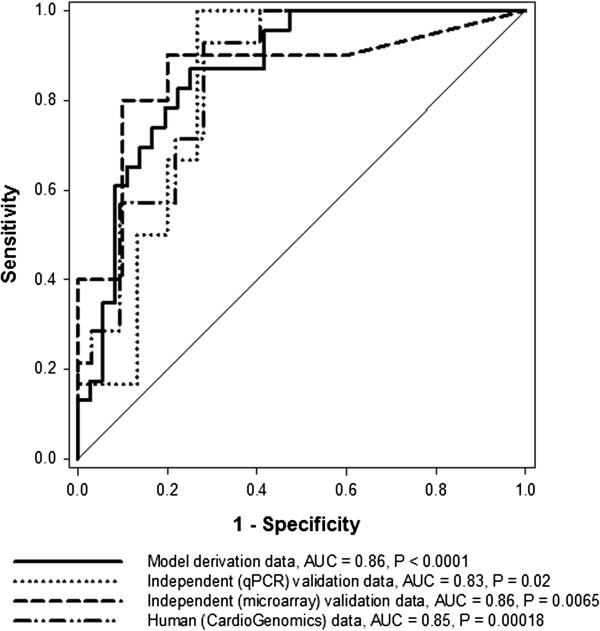
Results: The gene co-expression network consisted of 178 genes and 7298 associations. The network was dissected into statistically and biologically meaningful communities of highly interconnected and co-expressed genes. Among the most significant communities, one was distinctly associated with molecular events underlying heart repair after MI (P < 0.05). Col5a2, a gene previously not specifically linked to MI response but responsible for the classic type of Ehlers-Danlos syndrome, was found to have many and strong co-expression associations within this community (11 connections with ρ > 0.85). To validate the potential clinical application of this discovery, we tested its disease discriminatory capacity on independently generated MI datasets from mice and humans. High classification accuracy and concordance was achieved across these evaluations with areas under the receiving operating characteristic curve above 0.8.

Conclusion: Network-based approaches can enable the discovery of clinically-interesting predictive insights that are accurate and robust. Col5a2 shows predictive potential in MI, and in principle may represent a novel candidate marker for the identification and treatment of ischemic cardiovascular disease.


Figures

Figure 1
Figure 1
Illustration of fundamental network analysis concepts. A and B show hypothetical examples of candidate communities that can be detected by our approach. Nodes and edges represent genes and co-expression values respectively. The thickness of the edges can be used to graphically represent co-expression levels.
Figure 2
Figure 2
Gene co-expression network in MI encodes clinically interesting knowledge. A. Graphical view of the network. Nodes and edges represent genes and co-expression relationships respectively. Because genes are highly densely interconnected, edges are difficult to graphically discern, and here are shown as a grey area inside the (circle) network layout. B. Overview of the statistical landscape of network communities detected. The q values reflect the statistical relevance of the candidate communities. C. A highly interconnected and co-expressed community, in which Col5a2 is shown as a potential relevant gene with predictive value. The thickness of the edges reflects the observed co-expression values.
Figure 3
Figure 3
Gene expression patterns of top candidate community. Expression values are color-coded: from low (blue) to high (red), and levels of differential expression are shown as adjusted P values.
Figure 4
Figure 4
Col5a2 expression values in multiple independently generated datasets. * denotes significant differences between mean values observed in control and case groups at the P = 0.05 level. Vertical bars represent 95% confidence intervals. Case groups represent disease categories.
Figure 5
Figure 5
Disease phenotype discriminatory capacity of a model in which Col5a2 expression is used as input. ROC (receiving operating characteristic) curves obtained when applying the model on independently generated datasets are shown. Diagonal line represents classification performance obtained from a random classification model. P values associated with AUCs estimate their statistical significance in relation to random model. ROC curves and AUC values shown refer to test results on: derivation, independent qPCR, independent mice microarray and human microarray datasets.

References

    1. Nabel EG, Braunwald E. A tale of coronary artery disease and myocardial infarction. N Engl J Med. 2012;366:54–63. doi: 10.1056/NEJMra1112570. - DOI - PubMed
    1. Ertl G, Frantz S. Healing after myocardial infarction. Cardiovasc Res. 2005;66:22–32. doi: 10.1016/j.cardiores.2005.01.011. - DOI - PubMed
    1. Fraccarollo D, Galuppo P, Bauersachs J. Novel therapeutic approaches to post-infarction remodelling. Cardiovasc Res. 2012;94:293–303. doi: 10.1093/cvr/cvs109. - DOI - PubMed
    1. Schadt EE. Molecular networks as sensors and drivers of common human diseases. Nature. 2009;461:218–223. doi: 10.1038/nature08454. - DOI - PubMed
    1. Vidal M, Cusick ME, Barabasi AL. Interactome networks and human disease. Cell. 2011;144:986–998. doi: 10.1016/j.cell.2011.02.016. - DOI - PMC - PubMed

Publication types

Substances