. 2014 Sep;24(9):2297-308.
doi: 10.1093/cercor/bht073. Epub 2013 Apr 9.

Altered migratory behavior of interneurons in a model of cortical dysplasia: the influence of elevated GABAA activity

Affiliations

Altered migratory behavior of interneurons in a model of cortical dysplasia: the influence of elevated GABAA activity

J Abbah et al. Cereb Cortex. 2014 Sep.

Abstract

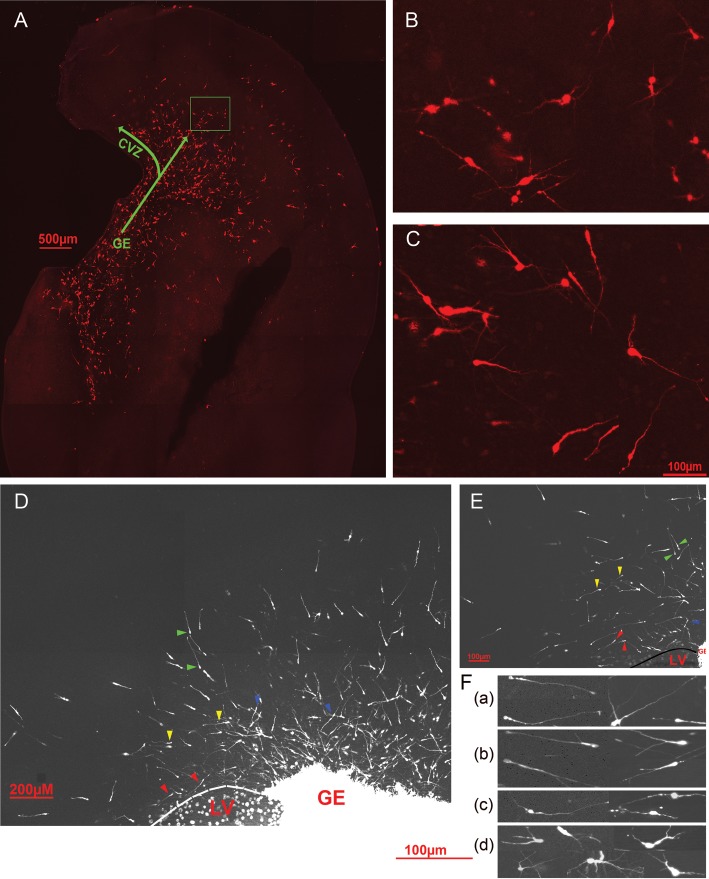
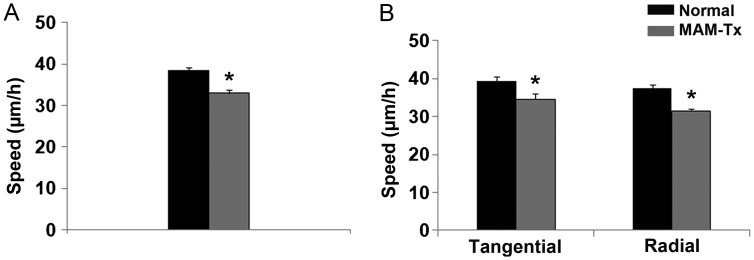
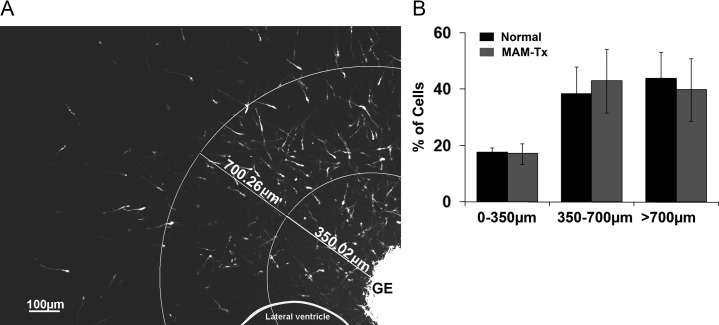
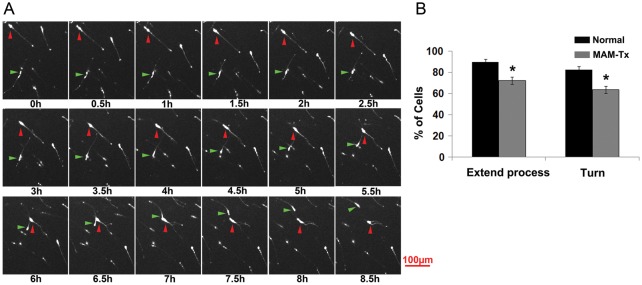
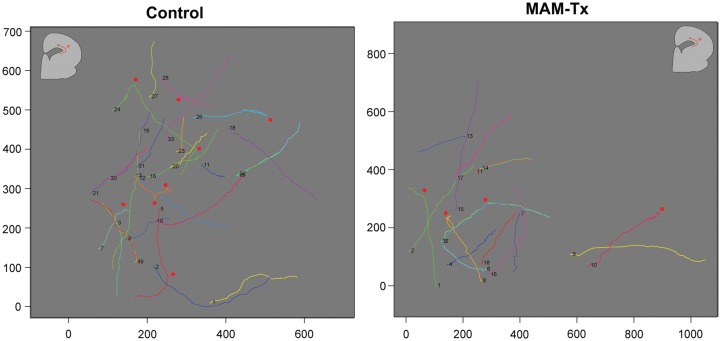
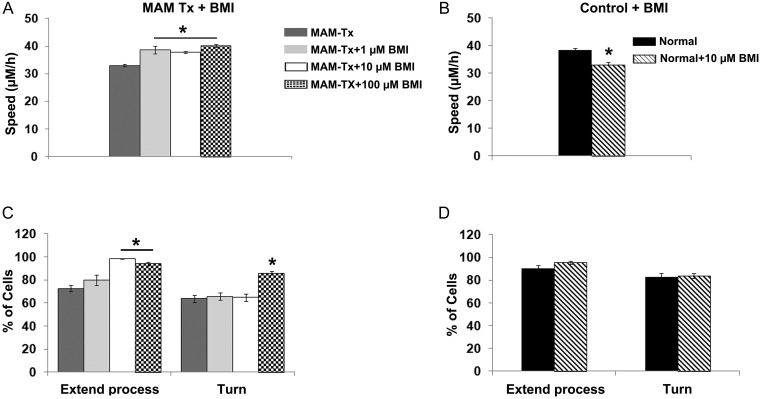
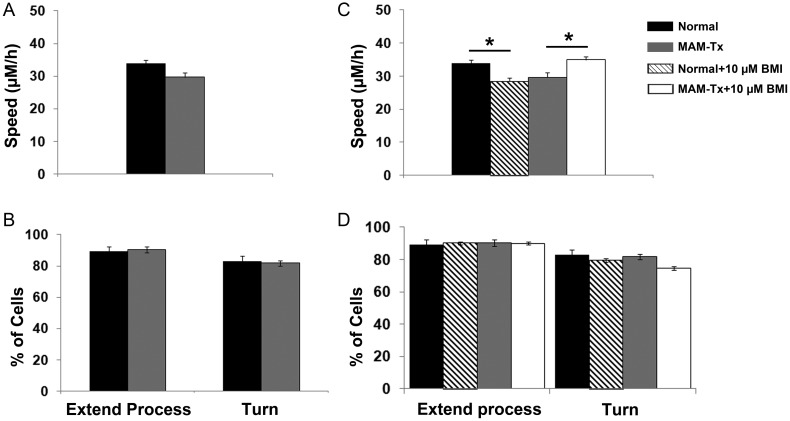
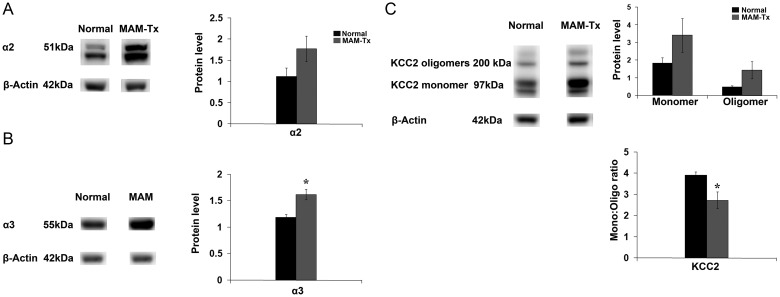
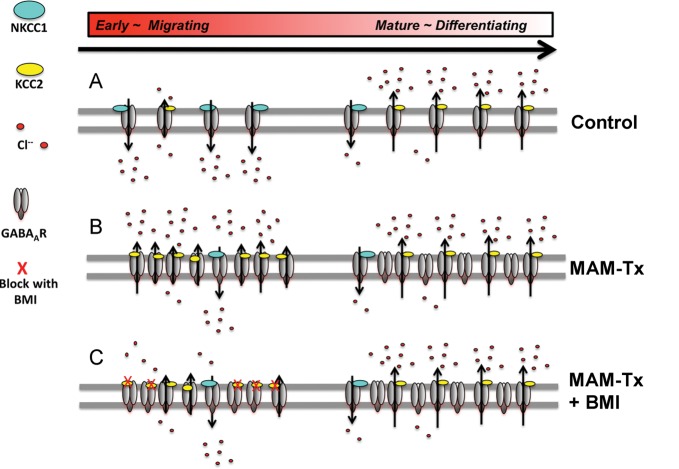
Appropriate function of the neocortex depends on timely generation and migration of cells produced in the germinal zones of the neocortex and ganglionic eminence (GE). Failure to accurately complete migration results in cortical dysplasia, a developmental syndrome implicated in many neurologic disorders. We developed a model of cortical dysplasia in ferrets involving administration of methylaxozymethanol acetate (MAM), an antimitotic, to pregnant ferrets on gestational day 33, leading to dramatic reduction of layer 4 in the neocortex. Here, using time-lapse video imaging, we investigate dynamic behavior of migrating cells arising from the GE and cortical ventricular zone (CVZ) in ferrets and the role of GABAA activity. Treatment with MAM significantly reduced migration speed and the relative proportion of cells arising from the GE demonstrating exploratory behavior. To a lesser extent, the behavior of cells leaving the CVZ was affected. Pharmacologic inhibition of GABAA receptors (GABAAR) improved the speed of migration and exploratory ability of migrating MAM-treated cells arising from the GE. Additionally, the expression of α2 and α3 subunits of GABAAR and the potassium chloride co-transporter (KCC2) increased in the neocortex of MAM-treated animals. After MAM treatment, increases in endogenous KCC2 and GABAAR combine to alter the dynamic properties and exploratory behavior of migrating interneurons in ferrets. We show a direct correlation between increased GABAA and KCC2 expression with impaired migration and ability to explore the environment.

Keywords: KCC2; MAM; development; ferret; neuronal migration.


Figures

Figure 1.
Figure 1.
Images of migrating neurons leaving the ganglionic eminence (GE) of a normal ferret. (A) Example of an organotypic culture obtained from a P0 ferret labeled by electroporation using a plasmid that codes for red fluorescent protein (RFP). (B,C) Higher power views of cells en route to the cortex revealing varied orientations and morphologies of migrating GE cells. B is taken from the boxed in region of A and C is from a different normal slice culture. The arrows indicate the path of the migrating cells. GE: ganglionic eminence; CVZ: cortical ventricular zone. (D) Migrating GE-derived neurons labeled with DiI in an organotypic culture of a MAM-treated animal display different orientations and positions within the neocortex: tangentially migrating GE cells within the VZ/SVZ region (red arrows), tangentially migrating GE cells within the intermediate zone (yellow arrows), radially oriented GE cells in the intermediate zone (green arrows) and radially oriented GE cell directed toward the ventricle (blue arrows). (E) A different organotypic culture of a MAM-treated animal labeled with DiI, showing similar orientations of migrating cells. Arrows mark the different orientations and positions of cells within the neocortex as described above. (F) Higher power images of cells obtained from several labeled organotypic cultures from both normal and MAM-treated animals; various morphologies can be seen including those with a single leading unbranched process (a), those with single leading but branched processes (b), bipolar cells (c), and cells with multiple leading processes (d). The images shown in (d) are from an electroporated slice, while those from (a) to (c) are from DiI-injected slices. GE, ganglionic eminence; LV, lateral ventricle. Scale is for F.
Figure 2.
Figure 2.
Effect of MAM treatment on the speed and orientation of migrating interneurons leaving the ganglionic eminence and traveling to the neocortex. (A) Neurons leaving the GE travel faster in normal slices compared with those in MAM-treated slices, n = 435 cells (normal) and 458 cells (MAM-treated). (B) Cells traveling in either the radial or tangential direction travel slower in MAM-treated slices. Tangentially migrating cells: n = 129 (normal), 105 (MAM-treated); radially migrating cells: n = 223 (normal), 348 (MAM-treated). Significance determined using Student's t-test; *P < 0.05. Error bars = standard error of mean.
Figure 3.
Figure 3.
Distribution of cells leaving the GE and traveling to the neocortex. (A) To determine if cells migrated different distances after treatment with MAM, roughly concentric regions were created to count the neurons that traveled up to 350 μm from the border of the GE VZ, from 350 to 700 μm from that border, or greater than 700 μm from the center of DiI injection. (B) After 48 h in culture, there were no significant differences in the overall distribution of cells leaving the GE in normal slices versus those in MAM-treated slices, A χ2 distribution showed no significant differences. n = 12 slices (MAM-treated), 10 slices (normal). Error bars = standard error of mean. GE, ganglionic eminence.
Figure 4.
Figure 4.
Effect of MAM treatment on the ability of migrating GE cells to extend multiple leading processes and initiate a change in direction of movement. (A) Sequence of images of DiI-labeled GE cells during time-lapse imaging for 8.5 h. Two cells are indicated with either a red or green arrow and followed over time. The cell labeled with the red arrow moves diagonally from the upper left to the approximate center of the image. At 6.5 h it branches and moves toward the right. The cell labeled with a green arrow remains relatively still from 0 to0.4 h. At this point, it begins to move upward and curves to the left, moving out of view at 8.5 h. (B) The percent of migrating cells extending new processes was evaluated in normal and MAM-treated slices. After MAM treatment, migrating cells extended fewer new processes and displayed fewer turns/changes in the direction of movement. n = 23 slices/366 cells (MAM-treated), 21 slices/239 cells (normal); *P ≤ 0.05, Student's t-test. Error bars = standard error of mean.
Figure 5.
Figure 5.
Tracks of cells in normal and MAM-treated slices. (A) The positions of migrating cells were tracked every 30 min over a period of 24 h. Each cell is indicated with a different color and a number. This is an example taken from a normal cortex. (B) The tracks of cells leaving the ganglionic eminence (GE) of MAM-treated cortex are indicated here. The position of each cell is illustrated with a different color and number. The cells leaving the normal GE show more variability in their route, compared with those leaving the GE of MAM-treated brains. The numbers on the x- and y-axes indicate the size of the area of the neocortex analyzed while the length of each track indicates a rough estimate of the distance traveled in micrometers. The outline of ferret cortex in A and B indicates the approximate path of cell movement (red arrow). Each red dot indicates where a traveling cell made a change in the direction of movement that was at least 45° from the original path.
Figure 6.
Figure 6.
Administration of bicuculline (BMI) at different doses (1, 10, and 100 μM) to MAM-treated slices results in an increase in the speed and exploratory behavior of migrating cells for all doses tested. MAM-treated slices were placed in culture with BMI added to the medium. (A) The addition of BMI significantly increased the speed of migration in the treated slices at all doses tested. Speeds were significantly different from the MAM-treated condition. One-way ANOVA followed by the Tukey post hoc test, *P ≤ 0.05. (B) Adding 10-μM BMI to the media of normal organotypic cultures decreases the speed of migration. Student's t-test, *P ≤ 0.05. (C) The addition of BMI also improved the ability of MAM-treated cells to extend processes. One-way ANOVA followed by the Tukey post hoc test, *P ≤ 0.05. The number of turns in the direction of movement after MAM treatment increased only with the highest dose of BMI. ANOVA followed by the least significant difference post hoc test, *P < 0.05. (D) Adding 10-μM BMI to the media of normal organotypic cultures does not affect exploratory behavior: extending a process or turning. Significant differences are shown for comparison with the MAM-treated condition (A,C) or with the normal condition (C,D). Speed: n = 467 cells (MAM-treated),179 cells (MAM-treated + 1 μM BMI), 350 cells (MAM-treated + 10 μM BMI), 204 cells (MAM-treated + 100 μM BMI), 411 (normal + 10 μM BMI); exploratory behavior: n = 23 slices/366 cells (MAM-treated), 8 slices/103 cells (MAM-treated + 1 μM BMI), 22 slices/161 cells (MAM-treated + 10 μM BMI), 12 slices/116 cells (MAM-treated + 100 μM BMI), and 23 slices (normal + 10 μM BMI). Error bars = standard error of mean.
Figure 7.
Figure 7.
Effect of MAM treatment on the speed of migration and exploratory behavior of cells leaving the cortical ventricular zone (CVZ) to the neocortex. (A) There were no significant differences in the speed of migration of cells leaving the CVZ from either normal or MAM-treated slices, although the cells leaving the CVZ in MAM-treated slices tended to move more slowly (P < 0.06, Student's t-test). n = 191 cells (normal) and 185 cells (E33 MAM). (B) No differences were observed in the ability of cells leaving the CVZ to extend processes or change the direction of movement or turn. Exploratory behavior: n = 13 slices/85 cells (normal) and n = 12 slices/75 cells (MAM-treated). (C) Treating normal cells leaving the CVZ with BMI showed that 10-μM BMI caused a significant reduction of speed. Adding 10 μM of BMI to the MAM-treated organotypic cultures, however, resulted in an increase in migration speed of the cells leaving the CVZ. n = 273 cells (normal + 10 μM BMI), n = 226 cells (MAM-treated + 10 μM BMI). One-way ANOVA followed by the Tukey post hoc test, *P ≤ 0.05. (D) The cells leaving the CVZ showed no differences between normal and MAM treated in their ability of extend a process or turn. Adding BMI did not result in any significant differences between groups. n = 25 slices/192 cells (normal + 10 μM BMI) and n = 18 slices/142 cells (MAM-treated + 10 μM BMI).
Figure 8.
Figure 8.
Expression of GABAA receptor subunits and KCC2 following treatment with MAM. (A) Treatment with MAM results in an increase in the expression of GABAAα2, and (B) GABAAα3 receptor subunits in the neocortex as demonstrated by western blots. (C) Both monomeric and oligomeric forms of KCC2 are increased (top bar graph) with significant elevation in the ratio of KCC2 oligomer:monomer (bottom graph). Protein levels were determined by densitometric analysis using ImageJ software. For both normal and MAM-Tx animals, n = 4. Significance determined using the Student's t-test, P ≤ 0.05 Error bars = standard error of mean.
Figure 9.
Figure 9.
Examples of GABAAR function in the development of normal and MAM-treated cortex. (A) depicts normal receptors that show higher expression of NKCC1 during early development and low expression of KCC2 (on the left). As they mature, the receptors express higher levels of KCC2 and lower levels of NKCC1 (on the right). The high NKCC1 levels allow easier migration of cells and the excitatory action of GABAAR. As the cells mature, the shift to KCC2 slows migration and results in the inhibitory action of GABAARs. (B) shows a hypothetical cell that expresses GABAAR after MAM-treatment. This cell shows high levels of GABAAR and KCC2, which slows migration and encourages the inhibitory action of GABAAR. The expression levels of KCC2 during development (left) are similar to those as the cells mature (right). (C) Blockade of GABAAR with BMI lowers the action of KCC2 and results in more normal actions during development in MAM-treated cells (on the left). As the cells mature, the GABAAR activity remains high (on the right). Levels of ambient chloride levels as a result of the expression of 2 cation-chloride transporters, KCC2 or NKCC1 are indicated.

Similar articles

Cited by

References

    1. Alifragis P, Liapi A, Parnavelas JG. Lhx6 regulates the migration of cortical interneurons from the ventral telencephalon but does not specify their GABA phenotype. J Neurosci. 2004;24:5643–5648. doi: 10.1523/JNEUROSCI.1245-04.2004. - DOI - PMC - PubMed
    1. Anderson AA, Eisenstat SL, Rubenstein JL. Interneuron migration from basal forebrain to neocortex: dependence on Dlx genes. Science. 1997;278:474–476. doi: 10.1126/science.278.5337.474. - DOI - PubMed
    1. Ang ESBC, Haydar TF, Gluncic V, Rakic P. Four-dimensional migratory coordinates of GABAergic interneurons in the developing mouse cortex. J Neurosci. 2003;23(13):5805–5815. - PMC - PubMed
    1. Behar TN, Li YX, Tran HT, Ma W, Dunlap V, Scott C, Barker JL. GABA stimulates chemotaxis and chemokinesis of embryonic cortical neurons via calcium-dependent mechanisms. J Neurosci. 1996;16:1808–1818. - PMC - PubMed
    1. Behar TN, Smith SV, Kennedy RT, McKenzie JM, Maric I, Barker JL. GABAB receptors mediate motility signals for migrating embryonic cortical cells. Cereb Cortex. 2001;11(8):744–753. doi: 10.1093/cercor/11.8.744. - DOI - PubMed

Publication types

MeSH terms