

MicroRNA-143 inhibits tumor growth and angiogenesis and sensitizes chemosensitivity to oxaliplatin in colorectal cancers
- PMID: 23574723
- PMCID: PMC3674066
- DOI: 10.4161/cc.24477
MicroRNA-143 inhibits tumor growth and angiogenesis and sensitizes chemosensitivity to oxaliplatin in colorectal cancers
Abstract
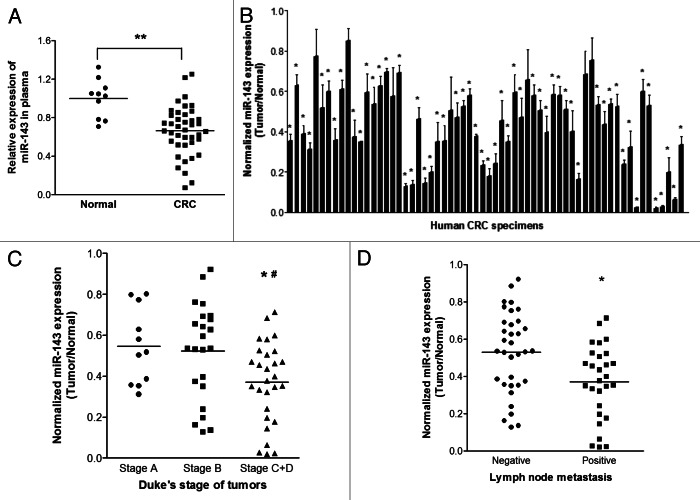
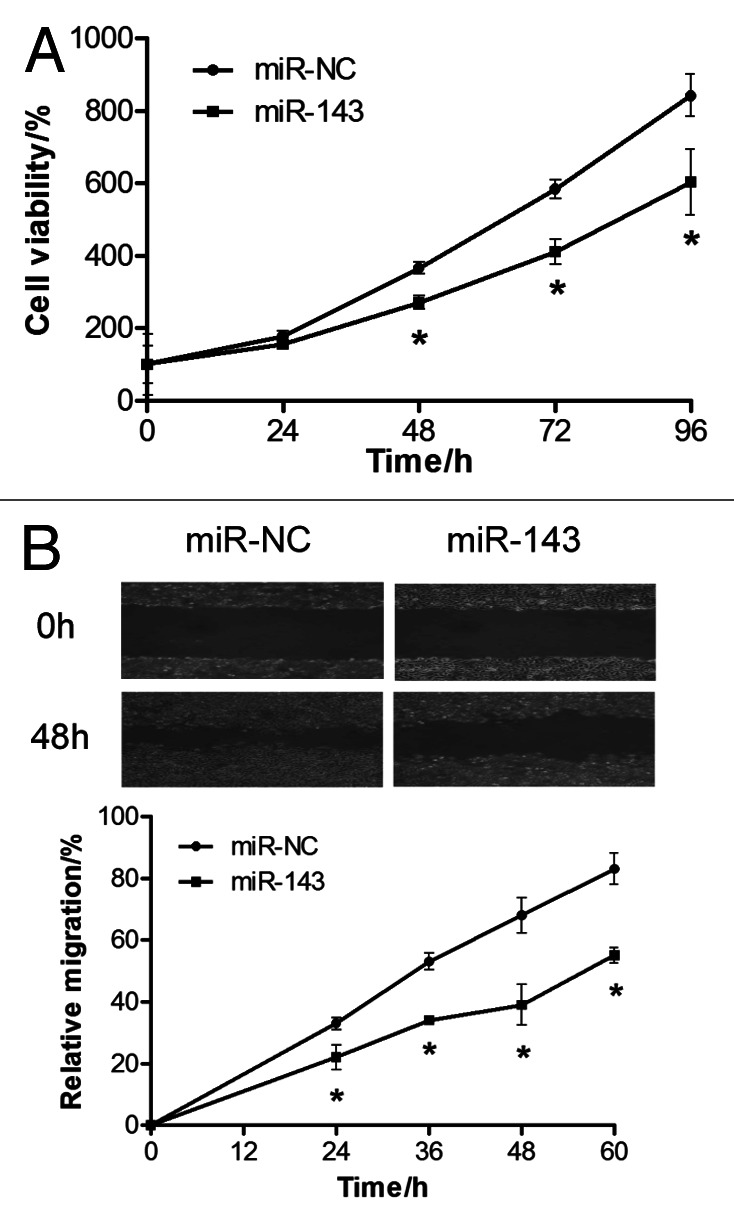
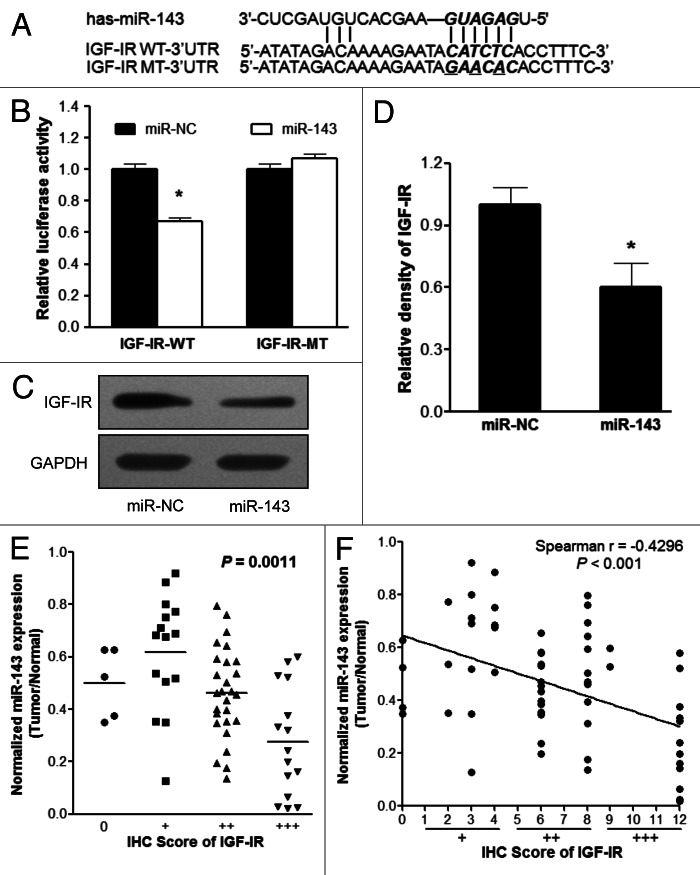
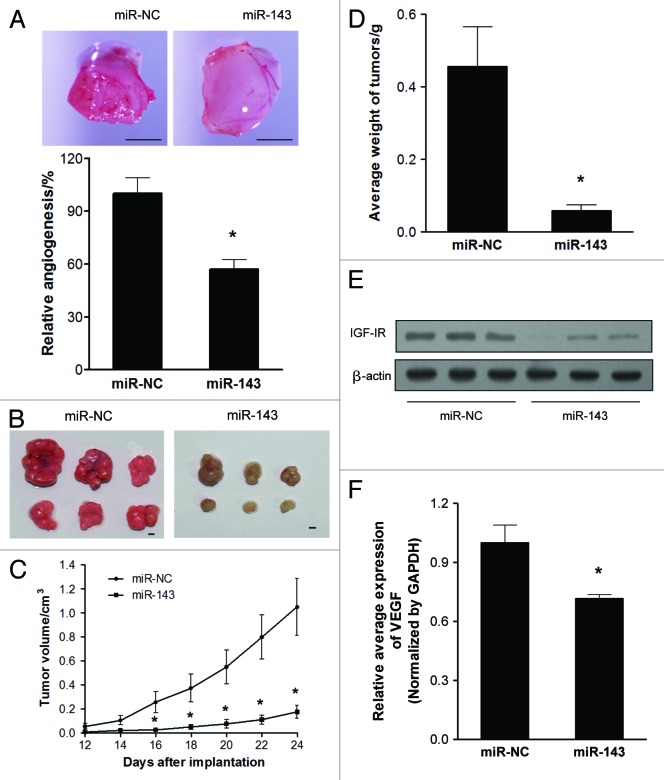
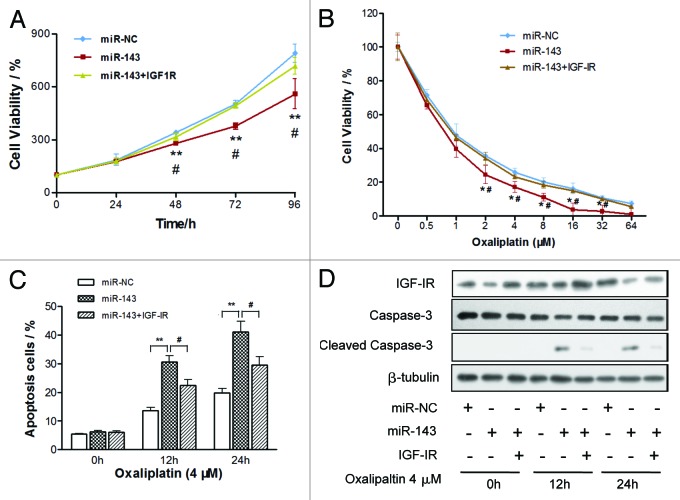
Colorectal cancer (CRC) is one of the leading cancer-related causes of death in the world. Recently, downregulation of microRNA-143 (miR-143) has been observed in CRC tissues. Here in this study, we found that miR-143 expression was downregulated both in CRC patients' blood samples and tumor specimens. MiR-143 expression levels were strongly correlated with clinical stages and lymph node metastasis. Furthermore, insulin-like growth factor-I receptor (IGF-IR), a known oncogene, was a novel direct target of miR-143, whose expression levels were inversely correlated with miR-143 expression in human CRC specimens. Overexpression of miR-143 inhibited cell proliferation, migration, tumor growth and angiogenesis and increased chemosensitivity to oxaliplatin treatment in an IGF-IR-dependent manner. Taken together, these results revealed that miR-143 levels in human blood and tumor tissues are associated with CRC cancer occurrence, metastasis and drug resistance, and miR-143 levels may be used as a new diagnostic marker and therapeutic target for CRC in the future.
Keywords: IGF-IR; angiogenesis; chemotherapy; microRNA-143; tumorigenesis.
Figures
Similar articles
-
The Plasma microRNA miR-1914* and -1915 Suppresses Chemoresistant in Colorectal Cancer Patients by Down-regulating NFIX.Curr Mol Med. 2016;16(1):70-82. doi: 10.2174/1566524016666151222144656. Curr Mol Med. 2016. PMID: 26695693
-
MiR-590-5p inhibits colorectal cancer angiogenesis and metastasis by regulating nuclear factor 90/vascular endothelial growth factor A axis.Cell Death Dis. 2016 Oct 13;7(10):e2413. doi: 10.1038/cddis.2016.306. Cell Death Dis. 2016. PMID: 27735951 Free PMC article.
-
MicroRNA-497 inhibits tumor growth and increases chemosensitivity to 5-fluorouracil treatment by targeting KSR1.Oncotarget. 2016 Jan 19;7(3):2660-71. doi: 10.18632/oncotarget.6545. Oncotarget. 2016. PMID: 26673620 Free PMC article.
-
The emerging role of microRNA-126 as a potential therapeutic target in cancer: a comprehensive review.Pathol Res Pract. 2023 Aug;248:154631. doi: 10.1016/j.prp.2023.154631. Epub 2023 Jun 19. Pathol Res Pract. 2023. PMID: 37393667 Review.
-
MicroRNA-1: Diverse role of a small player in multiple cancers.Semin Cell Dev Biol. 2022 Apr;124:114-126. doi: 10.1016/j.semcdb.2021.05.020. Epub 2021 May 24. Semin Cell Dev Biol. 2022. PMID: 34034986 Free PMC article. Review.
Cited by
-
A Study on Effect of Oxaliplatin in MicroRNA Expression in Human Colon Cancer.J Cancer. 2018 May 22;9(11):2046-2053. doi: 10.7150/jca.24474. eCollection 2018. J Cancer. 2018. PMID: 29896290 Free PMC article.
-
MicroRNAs in colorectal cancer as markers and targets: Recent advances.World J Gastroenterol. 2014 Apr 21;20(15):4288-99. doi: 10.3748/wjg.v20.i15.4288. World J Gastroenterol. 2014. PMID: 24764666 Free PMC article. Review.
-
Colorectal Cancer: From the Genetic Model to Posttranscriptional Regulation by Noncoding RNAs.Biomed Res Int. 2017;2017:7354260. doi: 10.1155/2017/7354260. Epub 2017 May 10. Biomed Res Int. 2017. PMID: 28573140 Free PMC article. Review.
-
MiR-381 functions as a tumor suppressor in colorectal cancer by targeting Twist1.Onco Targets Ther. 2016 Mar 7;9:1231-9. doi: 10.2147/OTT.S99228. eCollection 2016. Onco Targets Ther. 2016. PMID: 27094913 Free PMC article.
-
MicroRNA-766-3p-mediated downregulation of HNF4G inhibits proliferation in colorectal cancer cells through the PI3K/AKT pathway.Cancer Gene Ther. 2022 Jun;29(6):803-813. doi: 10.1038/s41417-021-00362-0. Epub 2021 Jun 22. Cancer Gene Ther. 2022. PMID: 34158627
References
Publication types
MeSH terms
Substances
Grants and funding
LinkOut - more resources
Full Text Sources
Other Literature Sources
Medical