. 2013 Apr 10;14(4):7853-65.
doi: 10.3390/ijms14047853.

Frataxin deficiency leads to reduced expression and impaired translocation of NF-E2-related factor (Nrf2) in cultured motor neurons

Affiliations

Frataxin deficiency leads to reduced expression and impaired translocation of NF-E2-related factor (Nrf2) in cultured motor neurons

Valentina D'Oria et al. Int J Mol Sci. .

Abstract

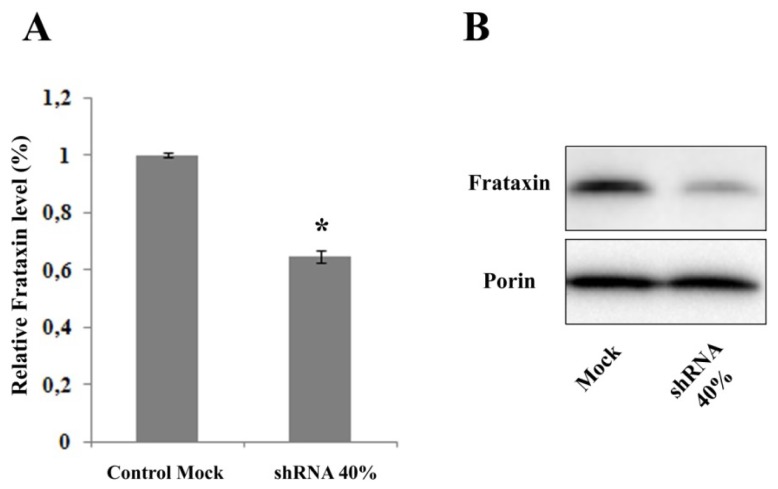
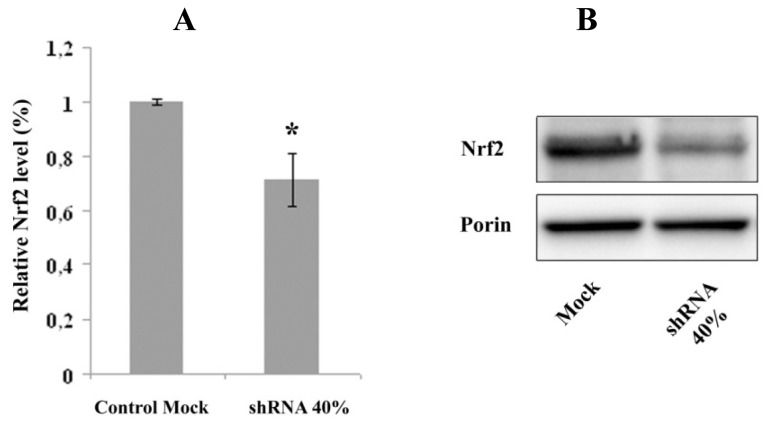
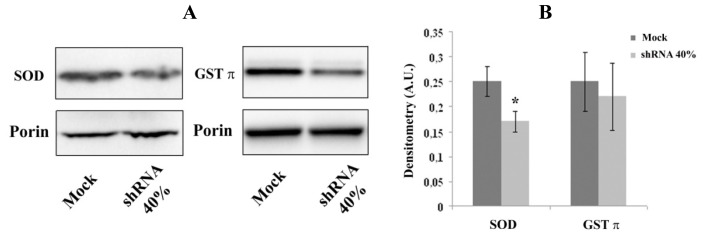
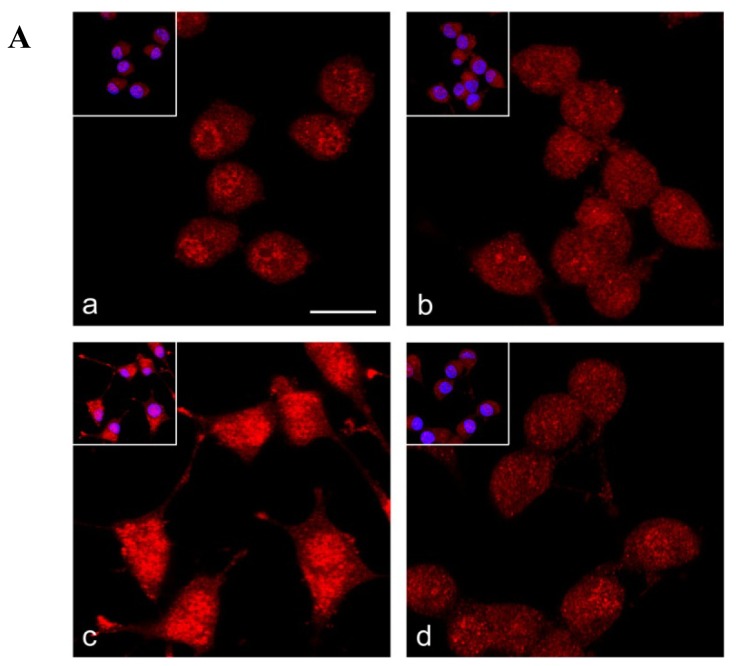
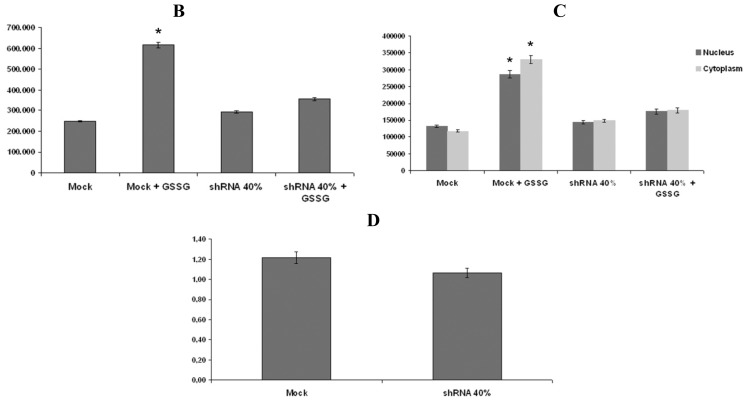
Oxidative stress has been implicated in the pathogenesis of Friedreich's Ataxia (FRDA), a neurodegenerative disease caused by the decreased expression of frataxin, a mitochondrial protein responsible of iron homeostasis. Under conditions of oxidative stress, the activation of the transcription factor NF-E2-related factor (Nrf2) triggers the antioxidant cellular response by inducing antioxidant response element (ARE) driven genes. Increasing evidence supports a role for the Nrf2-ARE pathway in neurodegenerative diseases. In this study, we analyzed the expression and the distribution of Nrf2 in silenced neurons for frataxin gene. Decreased Nrf2 mRNA content and a defective activation after treatment with pro-oxidants have been evidenced in frataxin-silenced neurons by RT-PCR and confocal microscopy. The loss of Nrf2 in FRDA may greatly enhance the cellular susceptibility to oxidative stress and make FRDA neurons more vulnerable to injury. Our findings may help to focus on this promising target, especially in its emerging role in the neuroprotective response.


Figures

Figure 1
Figure 1
(A) RT-PCR frataxin level. NSC34 neurons were transduced with lentivectors encoding for shRNA sequences against murine frataxin (shRNA 40%) or containing only the GFP reporter gene (control Mock). The level of frataxin mRNA was quantified by real-time RT-PCR. The results were expressed as percentage of the control Mock-transfected cells. The error bars indicate SD (*p < 0.05); (B) Representative western blot of the frataxin protein level. Porin was used as reference protein.
Figure 2
Figure 2
(A) RT-PCR NF-E2-related factor (Nrf2) level. Nrf2 mRNA transcripts were quantified in shRNA 40% and in control Mock neurons by real-time RT-PCR. The results were expressed as percentage of the control Mock transfected cells. The error bars indicate SD (*p < 0.05); (B) Representative western blot of the Nrf2 protein level. Porin was used as reference protein.
Figure 3
Figure 3
(A) Representative western blots of downstream Nrf2 target proteins. Forty microgrammes shRNA 40% and Mock neurons were applied onto 4%–12% Bis–Tris SDS-polyacrylamide gel electrophoresis as reported in Experimental Section, and probed with anti-SOD (1:1000 dilution) and anti-GST π (1:500 dilution) antibodies; (B) Densitometry of blots, normalized to porin. The error bars indicate SD (*p < 0.05). A B
Figure 4
Figure 4
Nrf2 distribution in control (Mock) and shRNA 40% neurons under basal and oxidative stress conditions. (A) The confocal microscopy analysis of control (a, c) and frataxin-silenced (b, d) neurons immunolabelled with anti-Nrf2 antibody (red) revealed an increase of the Nrf2 signal in the nucleus respect to the cytoplasm in control Mock cells (a), whereas shRNA 40% neurons didn’t show any difference between the two compartments (b). After GSSG treatment, control Mock neurons (c) exhibited a significant increase of Nrf2 immunostaining in both nuclear and cytoplasmic areas, whereas frataxin-silenced cells did not respond to the stimulus (d). Nuclei were counterstained with Hoechst (blue, double staining in insets). Bar: 20 μm; (BC) Total (B), nucleus/cytoplasm (C) Nrf2 fluorescence intensity in control Mock and shRNA 40% neurons before and after glutathione (GSSG) treatment; (D) Ratios of Nrf2 fluorescence intensities between nucleus and cytoplasm. Data are presented as the mean ± SEM (*p < 0.001). Nearly 150 nuclei were counted for each sample analyzed.
Figure 4
Figure 4
Nrf2 distribution in control (Mock) and shRNA 40% neurons under basal and oxidative stress conditions. (A) The confocal microscopy analysis of control (a, c) and frataxin-silenced (b, d) neurons immunolabelled with anti-Nrf2 antibody (red) revealed an increase of the Nrf2 signal in the nucleus respect to the cytoplasm in control Mock cells (a), whereas shRNA 40% neurons didn’t show any difference between the two compartments (b). After GSSG treatment, control Mock neurons (c) exhibited a significant increase of Nrf2 immunostaining in both nuclear and cytoplasmic areas, whereas frataxin-silenced cells did not respond to the stimulus (d). Nuclei were counterstained with Hoechst (blue, double staining in insets). Bar: 20 μm; (BC) Total (B), nucleus/cytoplasm (C) Nrf2 fluorescence intensity in control Mock and shRNA 40% neurons before and after glutathione (GSSG) treatment; (D) Ratios of Nrf2 fluorescence intensities between nucleus and cytoplasm. Data are presented as the mean ± SEM (*p < 0.001). Nearly 150 nuclei were counted for each sample analyzed.

References

    1. Oppenheimer D., Esiri M. Disease of the Basal Ganglia, Cerebellum and Motor Neurons. In: Adams J.H., Corsellis J., Duchen L.W., editors. Greenfield’s Neuropathology. 5th ed. Arnold; London, UK: 1992. pp. 988–1054.
    1. Fogel B.L., Perlman S. Clinical features and molecular genetics of autosomal recessive cerebellar ataxias. Lancet Neurol. 2007;6:245–257. - PubMed
    1. Alper G., Narayanan V. Friedreich’s ataxia. Pediatr. Neurol. 2003;28:335–341. - PubMed
    1. Sakamato N., Chastain P.D., Parniewski P., Ohshima K., Pandolfo M., Griffith J.D., Wells R.D. Sticky DNA: Self-association properties of long GAA TTC repeats in RR Y triplex structures from Friedreich’s ataxia. Mol. Cell. 1999;3:465–475. - PubMed
    1. Santos R., Lefevre S., Sliwa D., Seguin A., Camadro J.M., Lesuisse E. Friedreich ataxia: Molecular mechanisms, redox considerations, and therapeutic opportunities. Antioxid. Redox Signal. 2010;13:651–690. - PMC - PubMed