Tyrosine pathway regulation is host-mediated in the pea aphid symbiosis during late embryonic and early larval development
- PMID: 23575215
- PMCID: PMC3660198
- DOI: 10.1186/1471-2164-14-235
Tyrosine pathway regulation is host-mediated in the pea aphid symbiosis during late embryonic and early larval development
Abstract
Background: Nutritional symbioses play a central role in insects' adaptation to specialized diets and in their evolutionary success. The obligatory symbiosis between the pea aphid, Acyrthosiphon pisum, and the bacterium, Buchnera aphidicola, is no exception as it enables this important agricultural pest insect to develop on a diet exclusively based on plant phloem sap. The symbiotic bacteria provide the host with essential amino acids lacking in its diet but necessary for the rapid embryonic growth seen in the parthenogenetic viviparous reproduction of aphids. The aphid furnishes, in exchange, non-essential amino acids and other important metabolites. Understanding the regulations acting on this integrated metabolic system during the development of this insect is essential in elucidating aphid biology.
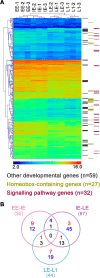
Results: We used a microarray-based approach to analyse gene expression in the late embryonic and the early larval stages of the pea aphid, characterizing, for the first time, the transcriptional profiles in these developmental phases. Our analyses allowed us to identify key genes in the phenylalanine, tyrosine and dopamine pathways and we identified ACYPI004243, one of the four genes encoding for the aspartate transaminase (E.C. 2.6.1.1), as specifically regulated during development. Indeed, the tyrosine biosynthetic pathway is crucial for the symbiotic metabolism as it is shared between the two partners, all the precursors being produced by B. aphidicola. Our microarray data are supported by HPLC amino acid analyses demonstrating an accumulation of tyrosine at the same developmental stages, with an up-regulation of the tyrosine biosynthetic genes. Tyrosine is also essential for the synthesis of cuticular proteins and it is an important precursor for cuticle maturation: together with the up-regulation of tyrosine biosynthesis, we observed an up-regulation of cuticular genes expression. We were also able to identify some amino acid transporter genes which are essential for the switch over to the late embryonic stages in pea aphid development.
Conclusions: Our data show that, in the development of A. pisum, a specific host gene set regulates the biosynthetic pathways of amino acids, demonstrating how the regulation of gene expression enables an insect to control the production of metabolites crucial for its own development and symbiotic metabolism.
Figures


Similar articles
-
Bacteriocyte Reprogramming to Cope With Nutritional Stress in a Phloem Sap Feeding Hemipteran, the Pea Aphid Acyrthosiphon pisum.Front Physiol. 2018 Oct 25;9:1498. doi: 10.3389/fphys.2018.01498. eCollection 2018. Front Physiol. 2018. PMID: 30410449 Free PMC article.
-
A dual-genome microarray for the pea aphid, Acyrthosiphon pisum, and its obligate bacterial symbiont, Buchnera aphidicola.BMC Genomics. 2006 Mar 14;7:50. doi: 10.1186/1471-2164-7-50. BMC Genomics. 2006. PMID: 16536873 Free PMC article.
-
Genomic insight into the amino acid relations of the pea aphid, Acyrthosiphon pisum, with its symbiotic bacterium Buchnera aphidicola.Insect Mol Biol. 2010 Mar;19 Suppl 2:249-58. doi: 10.1111/j.1365-2583.2009.00942.x. Insect Mol Biol. 2010. PMID: 20482655
-
Systemic analysis of the symbiotic function of Buchnera aphidicola, the primary endosymbiont of the pea aphid Acyrthosiphon pisum.C R Biol. 2009 Nov;332(11):1034-49. doi: 10.1016/j.crvi.2009.09.007. Epub 2009 Oct 14. C R Biol. 2009. PMID: 19909925 Review.
-
Genomic revelations of a mutualism: the pea aphid and its obligate bacterial symbiont.Cell Mol Life Sci. 2011 Apr;68(8):1297-309. doi: 10.1007/s00018-011-0645-2. Epub 2011 Mar 10. Cell Mol Life Sci. 2011. PMID: 21390549 Free PMC article. Review.
Cited by
-
Bacteriocyte plasticity in pea aphids facing amino acid stress or starvation during development.Front Physiol. 2022 Nov 10;13:982920. doi: 10.3389/fphys.2022.982920. eCollection 2022. Front Physiol. 2022. PMID: 36439244 Free PMC article.
-
Molecular evolutionary trends and feeding ecology diversification in the Hemiptera, anchored by the milkweed bug genome.Genome Biol. 2019 Apr 2;20(1):64. doi: 10.1186/s13059-019-1660-0. Genome Biol. 2019. PMID: 30935422 Free PMC article.
-
Genome Evolution of Bartonellaceae Symbionts of Ants at the Opposite Ends of the Trophic Scale.Genome Biol Evol. 2018 Jul 1;10(7):1687-1704. doi: 10.1093/gbe/evy126. Genome Biol Evol. 2018. PMID: 29982531 Free PMC article.
-
Metabolic alterations in the nymphal instars of Diaphorina citri induced by Candidatus Liberibacter asiaticus, the putative pathogen of huanglongbing.PLoS One. 2018 Jan 25;13(1):e0191871. doi: 10.1371/journal.pone.0191871. eCollection 2018. PLoS One. 2018. PMID: 29370262 Free PMC article.
-
Pea aphid Acyrthosiphon pisum sequesters plant-derived secondary metabolite L-DOPA for wound healing and UVA resistance.Sci Rep. 2016 Mar 23;6:23618. doi: 10.1038/srep23618. Sci Rep. 2016. PMID: 27006098 Free PMC article.
References
-
- Buchner P. In: Endosymbiosis of Animals with Plant Microorganisms. Buchner P, editor. New York: Interscience; 1965. Symbiosis in animals which suck plant juices; pp. 210–432.
-
- Douglas AE. The microbial dimension in insect nutritional ecology. Funct Ecol. 2009;23:38–47. doi: 10.1111/j.1365-2435.2008.01442.x. - DOI
-
- Baumann P, Moran NA, Baumann L, Dworkin M. In: The Prokaryotes. Dworkin M, editor. New York: Springer; 2000. Bacteriocyte-associated endosymbionts of insects; pp. 1–55.
-
- Ziegler H, Zimmermann DL, Milburn JA. In: Transport in Plants I - Phloem Transport. Zimmermann DL, Milburn JA, editor. Vol. 1. Berlin: Springer-Verlag; 1975. Nature of Substances in Phloem: Nature of Transported Substances; pp. 59–100.
Publication types
MeSH terms
Substances
Grants and funding
LinkOut - more resources
Full Text Sources
Other Literature Sources
Miscellaneous

