. 2013 Sep;7(9):1678-95.
doi: 10.1038/ismej.2013.59. Epub 2013 Apr 11.

Exploring nucleo-cytoplasmic large DNA viruses in Tara Oceans microbial metagenomes

Affiliations

Exploring nucleo-cytoplasmic large DNA viruses in Tara Oceans microbial metagenomes

Pascal Hingamp et al. ISME J. 2013 Sep.

Abstract

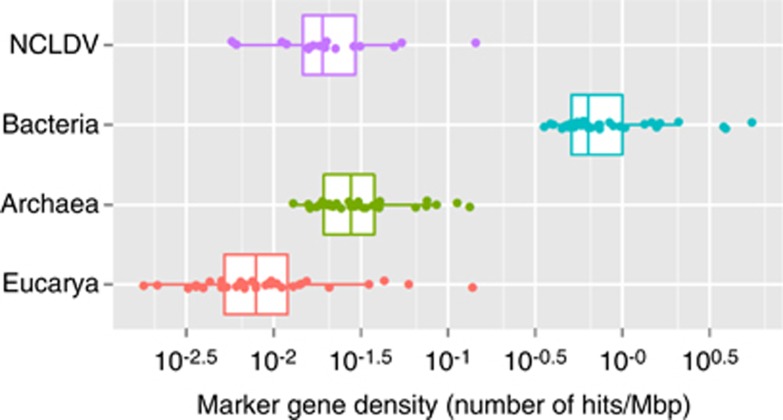
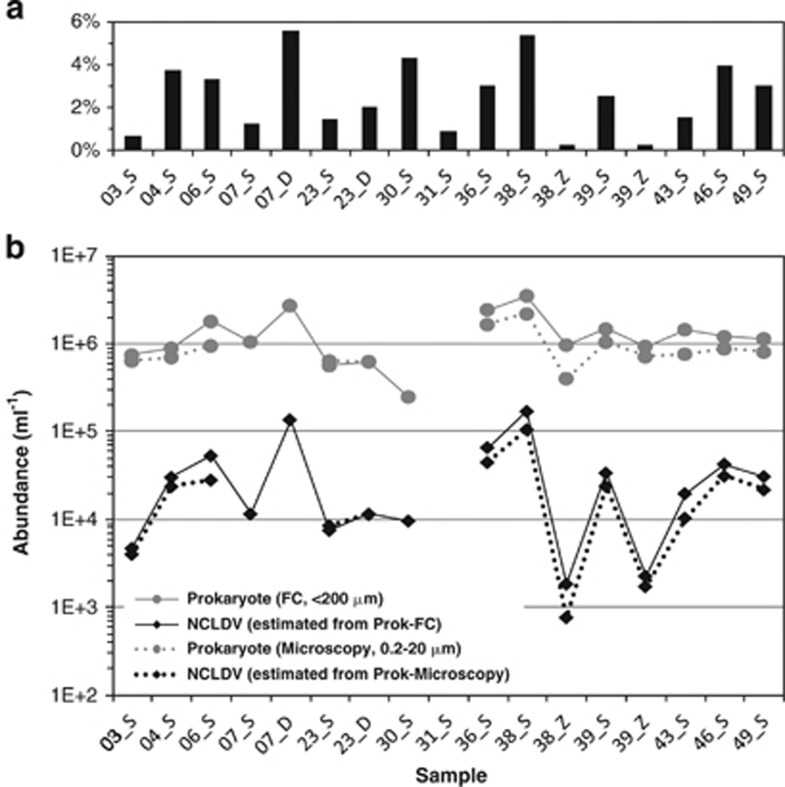
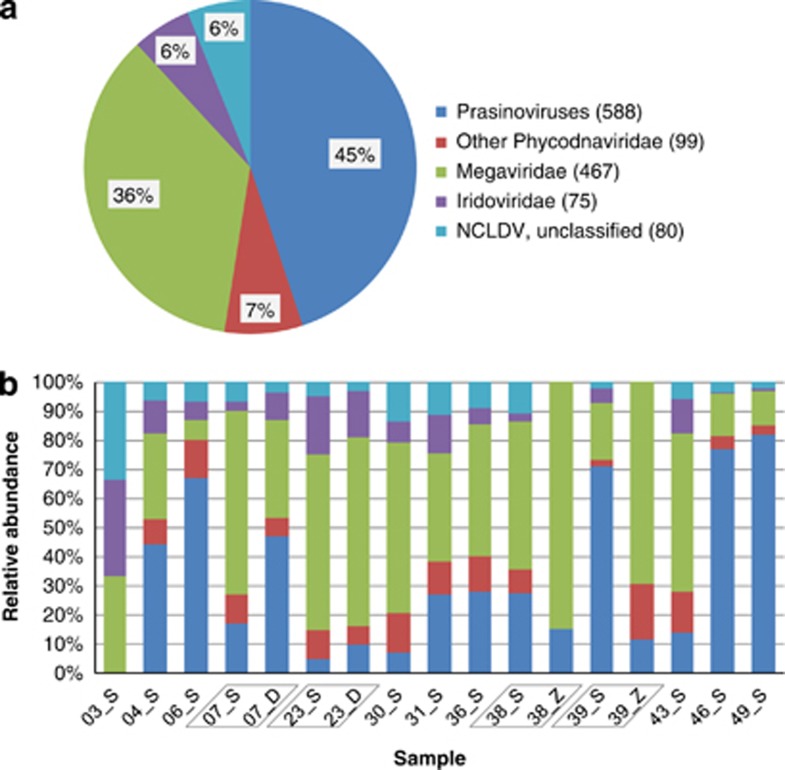
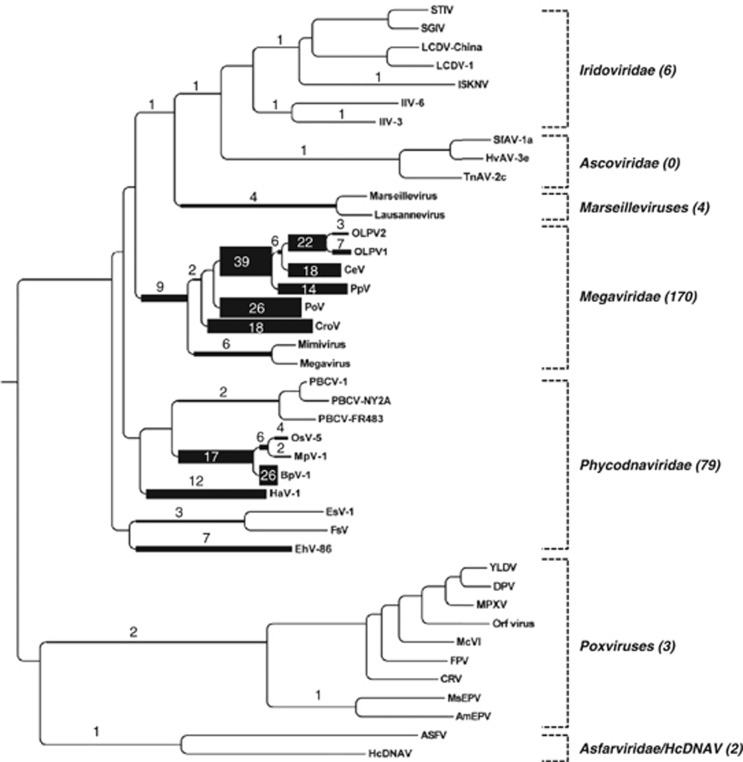
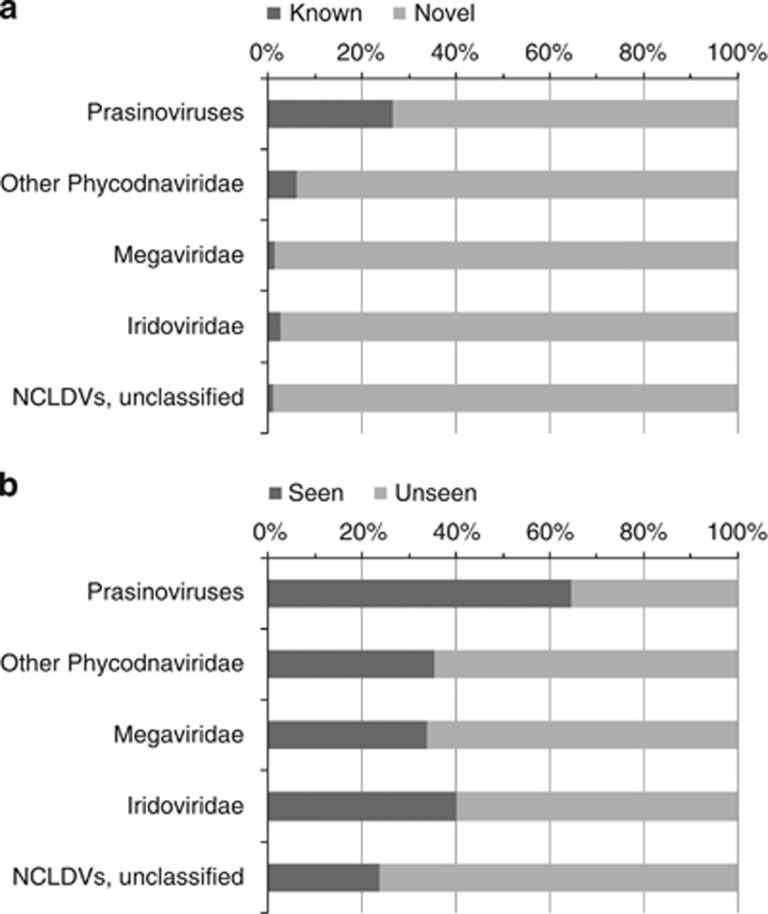
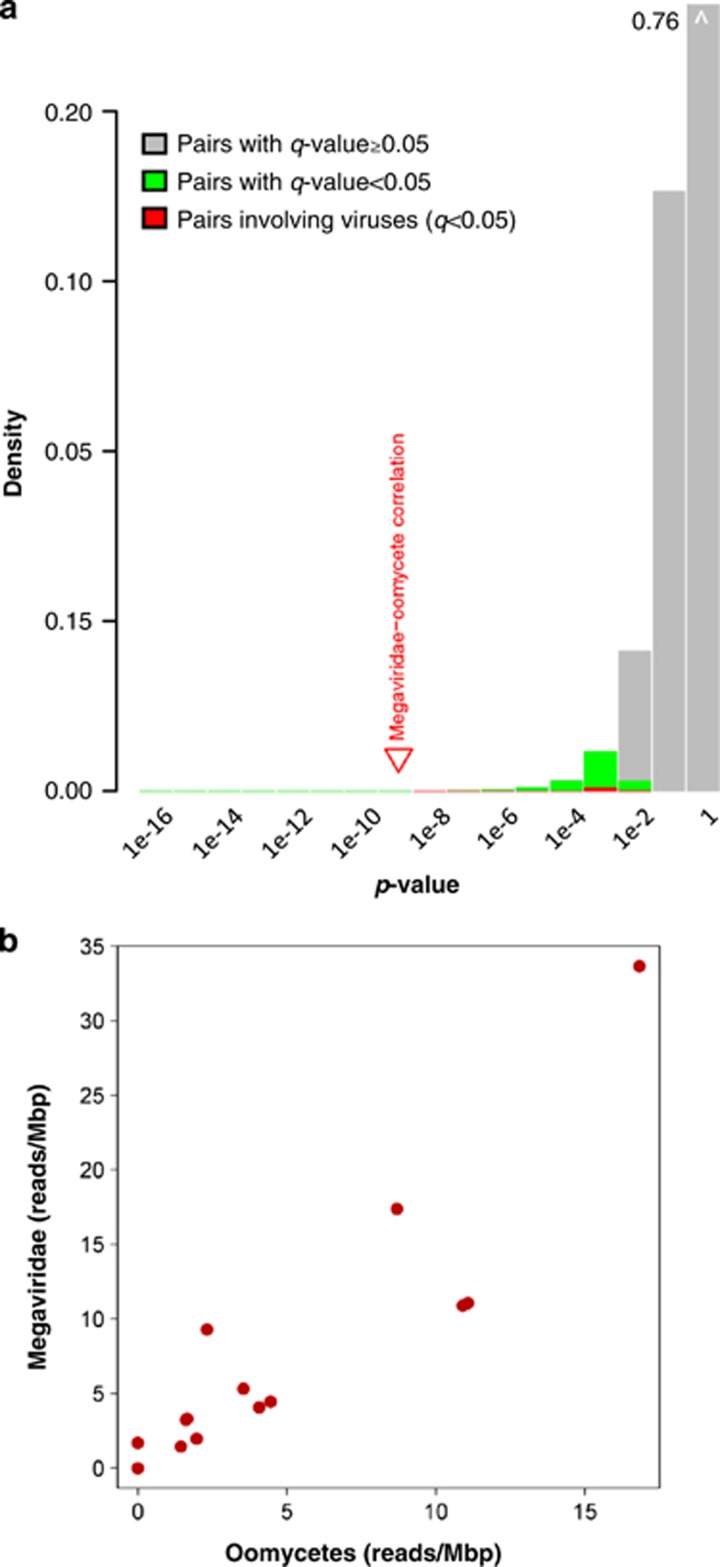
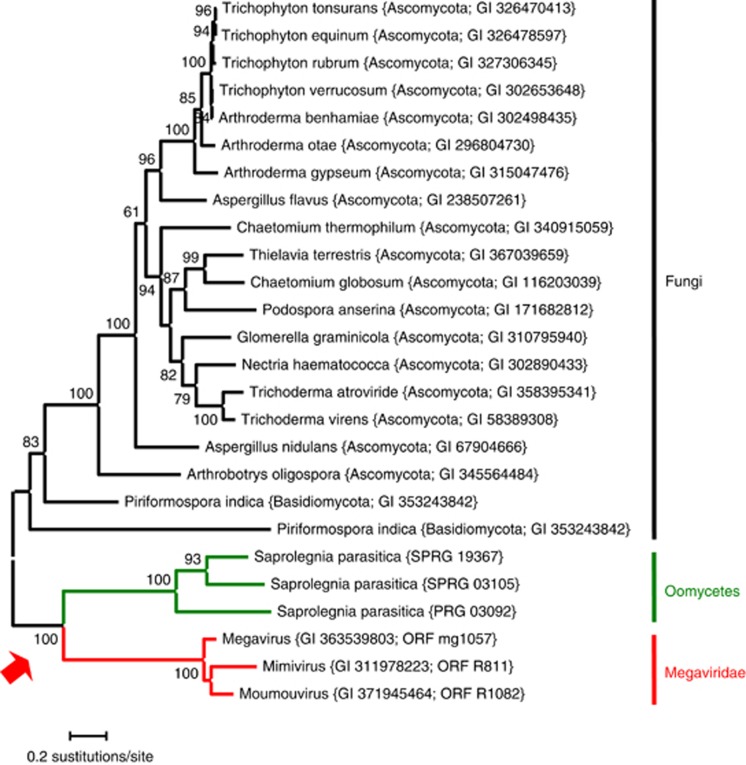
Nucleo-cytoplasmic large DNA viruses (NCLDVs) constitute a group of eukaryotic viruses that can have crucial ecological roles in the sea by accelerating the turnover of their unicellular hosts or by causing diseases in animals. To better characterize the diversity, abundance and biogeography of marine NCLDVs, we analyzed 17 metagenomes derived from microbial samples (0.2-1.6 μm size range) collected during the Tara Oceans Expedition. The sample set includes ecosystems under-represented in previous studies, such as the Arabian Sea oxygen minimum zone (OMZ) and Indian Ocean lagoons. By combining computationally derived relative abundance and direct prokaryote cell counts, the abundance of NCLDVs was found to be in the order of 10(4)-10(5) genomes ml(-1) for the samples from the photic zone and 10(2)-10(3) genomes ml(-1) for the OMZ. The Megaviridae and Phycodnaviridae dominated the NCLDV populations in the metagenomes, although most of the reads classified in these families showed large divergence from known viral genomes. Our taxon co-occurrence analysis revealed a potential association between viruses of the Megaviridae family and eukaryotes related to oomycetes. In support of this predicted association, we identified six cases of lateral gene transfer between Megaviridae and oomycetes. Our results suggest that marine NCLDVs probably outnumber eukaryotic organisms in the photic layer (per given water mass) and that metagenomic sequence analyses promise to shed new light on the biodiversity of marine viruses and their interactions with potential hosts.


Figures

Figure 1
Figure 1
Metagenome-based relative abundance of NCLDV and cellular genomes in the TOP data set. Seventeen TOP metagenomes (0.2–1.6 μm size fraction) were pooled and analyzed as a single data set to generate this plot. Each dot in the plot represents the density of one of the marker genes used in this study (16 markers for NCLDVs and 35 markers for cellular genomes). The estimated abundance of NCLDVs genomes is slightly lower than that of Archaea genomes and amounts to approximately 3% of bacterial genomes.
Figure 2
Figure 2
NCLDV genome abundance in the TOP data set. (a) Proportion of the average marker gene density for NCLDVs relative to that of prokaryotes (Bacteria and Archaea) for each of the 17 TOP metagenomes. (b) Experimentally measured prokaryotic cell densities (gray circles; 16 samples by microscopy and 13 samples by FC) were used to estimate the absolute abundances of NCLDV genomes (black squares) by rescaling the metagenome-based relative abundances. ‘S', ‘D' and ‘Z' in the sample names indicate the depths from which the samples were collected: ‘S' for surface, ‘D' for deep chlorophyll max and ‘Z' for oxygen minimum zone.
Figure 3
Figure 3
Metagenome-based relative abundance of NCLDV families. (a) Representation of different viral groups in the whole TOP metagenomic data set as measured by the NCLDV marker gene density. The number of marker reads taxonomically assigned to each viral group is shown in parentheses in the legend. (b) Representation of different viral groups in the 17 TOP metagenomic samples. ‘S', ‘D' and ‘Z' in the sample names indicate the depths from which the samples were collected: ‘S' for surface, ‘D' for deep chlorophyll max and ‘Z' for oxygen minimum zone. In both (a) and (b), three reads and one read assigned to Asfarviridae and Poxviridae, respectively, were omitted for presentation purpose.
Figure 4
Figure 4
Phylogenetic positions of metagenomic reads closely related to NCLDV DNA polymerase sequences. An HMM search with a PolB profile detected 2028 PolB-like peptide sequences in the TOP metagenomes. Each of these peptides was placed within a large reference phylogenetic tree containing diverse viral and cellular homologs (Supplementary Figure S1) with the use of Pplacer. Of these peptides, 264 were mapped on the branches leading to NCLDV sequences and are shown in this figure. The numbers of mapped metagenomic reads are shown on the branches and are reflected by branch widths. This result is consistent with the preponderance of the Phycodnaviridae and Megaviridae families seen in our BLAST-based marker gene analysis. Only the NCLDV part of the reference tree is shown.
Figure 5
Figure 5
Classification of NCLDV marker genes in the TOP data based on the level of sequence similarity to database sequences. Metagenomic reads showing ⩾80% amino-acid sequence identity to database sequences were classified as ‘known (or seen)', otherwise as ‘novel (or unseen)'. (a) BLAST result against UniProt. (b) BLAST result against the GOS data. The large proportions of ‘novel (and unseen)' genes suggest current environmental surveys are far from reaching saturation and that diverse yet unknown NCLDVs exist in the sea.
Figure 6
Figure 6
Taxon associations inferred from co-occurrence analysis. (a) Distribution of P-values for Spearman's correlation coefficients for taxon associations observed in the TOP metagenomic data. Colored (red and green) areas of the histogram represent taxon pairs showing statistically significant correlations. The position of the P-value for the hypothetical positive association between the ‘Megaviridae' and ‘oomycetes' taxonomic groups is indicated by a red triangle. (b) Correlated occurrence of 454 reads taxonomically assigned to the ‘Megaviridae' and the ‘oomycetes' groups by the BLAST-based 2bLCA method. Each dot corresponds to one of the 17 TOP samples analyzed. Axes represent the density of these reads (number of reads per Mbp) for each of the ‘Megaviridae' and the ‘oomycetes' groups.
Figure 7
Figure 7
Evidence of horizontal gene transfer between viruses and eukaryotes related to oomycetes. The displayed maximum likelihood tree was generated based on sequences of the Mimivirus hypothetical vWFA domain-containing protein (gi: 311978223) and its homologs using PhyML. The numbers on the branches indicate bootstrap percentages after 100 bootstrap sampling. The tree was mid-point rooted for visualization purpose. The grouping of the Megaviridae and oomycete sequences suggests a gene exchange between the lineage leading to Megaviridae and the lineage leading to oomycetes. Phylogenetic trees for the remaining five putative cases of horizontal gene transfers between these lineages are provided in the Supplementary Figure S9.

References

    1. Allen LZ, Ishoey T, Novotny MA, McLean JS, Lasken RS, Williamson SJ. Single virus genomics: a new tool for virus discovery. PLoS One. 2011;6:e17722. - PMC - PubMed
    1. Altschul SF, Madden TL, Schaffer AA, Zhang J, Zhang Z, Miller W, et al. Gapped BLAST and PSI-BLAST: a new generation of protein database search programs. Nucleic Acids Res. 1997;25:3389–3402. - PMC - PubMed
    1. Arslan D, Legendre M, Seltzer V, Abergel C, Claverie JM. Distant Mimivirus relative with a larger genome highlights the fundamental features of Megaviridae. Proc Natl Acad Sci USA. 2011;108:17486–17491. - PMC - PubMed
    1. Baxter L, Tripathy S, Ishaque N, Boot N, Cabral A, Kemen E, et al. Signatures of adaptation to obligate biotrophy in the Hyaloperonospora arabidopsidis genome. Science. 2010;330:1549–1551. - PMC - PubMed
    1. Bellec L, Grimsley N, Derelle E, Moreau H, Desdevises Y. Abundance, spatial distribution and genetic diversity of Ostreococcus tauri viruses in two different environments. Environ Microbiol Rep. 2010;2:313–321. - PubMed

Publication types

MeSH terms