. 2013 May 9;497(7448):239-43.
doi: 10.1038/nature12026. Epub 2013 Apr 10.

M-CSF instructs myeloid lineage fate in single haematopoietic stem cells

Affiliations

M-CSF instructs myeloid lineage fate in single haematopoietic stem cells

Noushine Mossadegh-Keller et al. Nature. .

Abstract

Under stress conditions such as infection or inflammation the body rapidly needs to generate new blood cells that are adapted to the challenge. Haematopoietic cytokines are known to increase output of specific mature cells by affecting survival, expansion and differentiation of lineage-committed progenitors, but it has been debated whether long-term haematopoietic stem cells (HSCs) are susceptible to direct lineage-specifying effects of cytokines. Although genetic changes in transcription factor balance can sensitize HSCs to cytokine instruction, the initiation of HSC commitment is generally thought to be triggered by stochastic fluctuation in cell-intrinsic regulators such as lineage-specific transcription factors, leaving cytokines to ensure survival and proliferation of the progeny cells. Here we show that macrophage colony-stimulating factor (M-CSF, also called CSF1), a myeloid cytokine released during infection and inflammation, can directly induce the myeloid master regulator PU.1 and instruct myeloid cell-fate change in mouse HSCs, independently of selective survival or proliferation. Video imaging and single-cell gene expression analysis revealed that stimulation of highly purified HSCs with M-CSF in culture resulted in activation of the PU.1 promoter and an increased number of PU.1(+) cells with myeloid gene signature and differentiation potential. In vivo, high systemic levels of M-CSF directly stimulated M-CSF-receptor-dependent activation of endogenous PU.1 protein in single HSCs and induced a PU.1-dependent myeloid differentiation preference. Our data demonstrate that lineage-specific cytokines can act directly on HSCs in vitro and in vivo to instruct a change of cell identity. This fundamentally changes the current view of how HSCs respond to environmental challenge and implicates stress-induced cytokines as direct instructors of HSC fate.


Conflict of interest statement

The authors declare no competing financial interests.

Figures

Figure 1
Figure 1. M-CSF activates the myeloid master regulator PU.1 in HSCs
ac, Representative FACS profile (a) and quantification of GFP expression in HSCs (b) or CD150hi HSCs (c) of PU.1-GFP reporter mice 16 h after control (PBS) or M-CSF injection. Horizontal bars show median. **P = 0.03; ***P = 0.009, calculated by a two-tailed non-parametric Mann–Whitney U-test. d, Quantitative RT–PCR analysis of PU.1 expression normalized to Gapdh expression (R.U.) in sorted HSCs after 16 h culture in the absence or presence of M-CSF, GM-CSF or G-CSF. Error bars show standard deviation of duplicates. G-CSF, granulocyte CSF; GM-CSF, granulocyte–macrophage CSF.
Figure 2
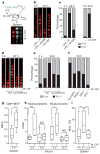
Figure 2. Continuous video imaging of PU.1+ cell generation from individual PU.1 HSCs
a, GFP fluorescence intensity at 10-min intervals (dots) and sliding median (lines) over 12-h observation time of three individual GFP-negative sorted HSCs from PU.1-GFP reporter mice after 18 h in M-CSF culture, representative of cells quantified in e (n = 39). Green, cells activating GFP; black, cell remaining GFP negative. b, Still photos taken at times indicated by symbols in a of fields with two representative HSCs (cells A, B) showing activation of PU.1 at different time points. Cell C was outside of the shown field. c, Still photos taken at 40-min intervals over 8 h of three representative HSCs in M-CSF culture without (cell C) or with activation of PU.1 (cells A, D), representative of cells quantified in e (n = 39). Complete videos are shown in Supplementary Videos 1–3. d, Quantification of PU.1+ cells derived from PU.1 HSCs (committed cells) with (n = 39) or without M-CSF (n = 42) as percentage of total cells after 24-h observation period. *P ≤0.1, calculated by a two-tailed non-parametric Mann–Whitney U-test. e, Timing of PU.1 activation in PU.1 HSCs of cells shown in d over 24-h observation period.
Figure 3
Figure 3. M-CSF activates PU.1 and instructs myeloid identity in single HSCs
ac, Gene expression analysis of single cells (rows) for lineage or stem-cell representative genes (columns) using duplicate nano-fluidic real-time PCR on Fluidigm array for freshly isolated HSCs (a) or after 16 h of culture in the absence (b) or the presence of M-CSF (c). Genes are grouped by lineage (indicated on top) and individual cells were clustered according to lineage-specific, mixed or lineage-negative gene expression profiles shown in bar and pie diagrams on the right. A full gene list and expanded view is shown in Supplementary Figs 7–9. **P = 0.04 calculated by a Pearson’s χ2 test, n = 41, 45, 45. Blue star highlights expression of PU.1 gene expression. Colour scale on the bottom shows correspondence between colour code and Ct values. E, erythroid; Lympho, lymphoid; Meg, megakaryocytic; MegE, megakaryocytic-erythroid; Myelo, myeloid. d, Individual PU.1+ cells with a myeloid gene expression profile (blue) or expressing other lineage genes (white) as a percentage of total cells. ***P = 0.009 (0 h) and P = 0.005 (−M-CSF), calculated by a two-tailed non-parametric Mann–Whitney U-test. e, Experimental design for transplantation of sorted PU.1 and PU.1+ HSCs from in vivo M-CSF-primed CD45.2 PU.1-GFP mice into sub-lethally irradiated CD45.1 recipients and analysis of progeny cells after 2 weeks in the spleen (Supplementary Fig. 14). f, g, Representative FACS profiles (f) and quantification of the ratio (g) of donor GMP and MEP progenitors derived from transplanted PU.1 or PU.1+HSCs before or after M-CSF stimulation in vivo. **P = 0.05; ***P = 0.01, calculated by a two-tailed non-parametric Mann–Witney U-test; n = 4, 8, 4. Whisker plots show median (lines), upper and lower quartiles (boxes) and extreme outliers (dotted whiskers).
Figure 4
Figure 4. M-CSF directly induces endogenous PU.1 protein in single HSCs in vivo and stimulates a reversible, PU.1-dependent myeloid differentiation preference
a, Experimental design of HSC transplantation into spleens of LPS-stimulated or M-CSF-stimulated hosts and typical immunofluorescence detection of PU.1 in CFSE-labelled HSCs 24 h after transplantation for two representative PU.1+ and one PU.1 cell. DAPI, nuclear stain. b, c, Representative immunofluorescence images (b) and percentage (c) of PU.1+ HSCs immediately (0 h) or 24 h after transplantation into LPS-stimulated host with isotype control (IC) or anti-M-CSF receptor blocking antibody (AFS98), or into M-CSF-injected hosts. (n ≥30). d, e, Representative immunofluorescence images (d) and percentage (e) of PU.1+cells immediately (0 h) or 24 h after transplantation of wild-type or M-CSFR−/− HSCs into mock or M-CSF-stimulated hosts (n ≥50). f, Percentage of PU.1+ cells 24 h after transplantation of HSCs into M-CSF-stimulated hosts in the absence or presence of kinase inhibitors for M-CSFR (GW2580), PI(3)K (LY294002), ERK/MAPK (PD98059) and SRC (SU6656) (n = 50). g, Ratio of donor GMP to MEP progenitors in the spleens of sub-lethally irradiated recipients 2 weeks after transplantation of in vivo M-CSF-primed or control HSCs. Experimental design is shown in Supplementary Fig. 11. ***P = 0.003, calculated by a two-tailed non-parametric Mann–Whitney U-test; n = 8, 9. h, Donor contribution to blood of competitively reconstituted mice 4 weeks and 6 weeks after transplantation of M-CSF-primed or control HSCs, expressed as a ratio of CD11b+ myeloid cells to platelets or CD19+ lymphoid cells. Experimental design, representative FACS profiles and quantification of contribution to individual lineages are shown in Supplementary Fig. 12. *P = 0.07, calculated by a two-tailed non-parametric Mann–Whitney U-test, n = 6, 4; ***P = 0.01, n = 10, 6. i, Donor contribution to Mac+ myeloid cells in the spleen of sub-lethally irradiated recipients 2 weeks after transplantation of control or M-CSF-primed HSCs with control (fl/fl) or deleted (Δ/Δ) PU.1 alleles. **P = 0.05, calculated by a two-tailed non-parametric Mann–Whitney U-test, n = 6, 4, 5. NS, not significant. Whisker plots show median (lines), upper and lower quartiles (boxes) and extreme outliers (dotted whiskers).

Comment in

References

    1. Metcalf D. Hematopoietic cytokines. Blood. 2008;111:485–491. - PMC - PubMed
    1. Rieger MA, Hoppe PS, Smejkal BM, Eitelhuber AC, Schroeder T. Hematopoietic cytokines can instruct lineage choice. Science. 2009;325:217–218. - PubMed
    1. Sarrazin S, et al. MafB restricts M-CSF dependent myeloid commitment divisions of hematopoietic stem cells. Cell. 2009;138:300–313. - PubMed
    1. Orkin SH. Diversification of haematopoietic stem cells to specific lineages. Nature Rev Genet. 2000;1:57–64. - PubMed
    1. Cantor AB, Orkin SH. Hematopoietic development: a balancing act. Curr Opin Genet Dev. 2001;11:513–519. - PubMed

Publication types

MeSH terms

Substances