. 2013:4:1672.
doi: 10.1038/ncomms2683.

VE-PTP regulates VEGFR2 activity in stalk cells to establish endothelial cell polarity and lumen formation

Affiliations
Free PMC article

VE-PTP regulates VEGFR2 activity in stalk cells to establish endothelial cell polarity and lumen formation

Makoto Hayashi et al. Nat Commun. 2013.
Free PMC article

Abstract

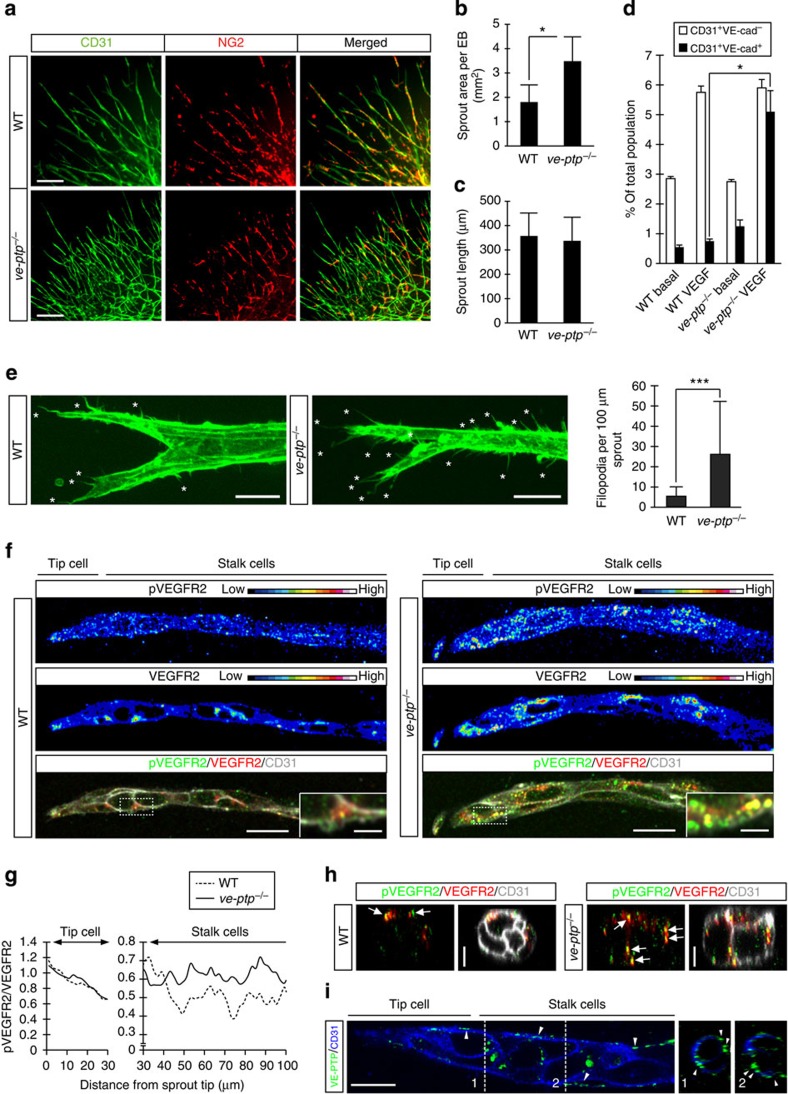
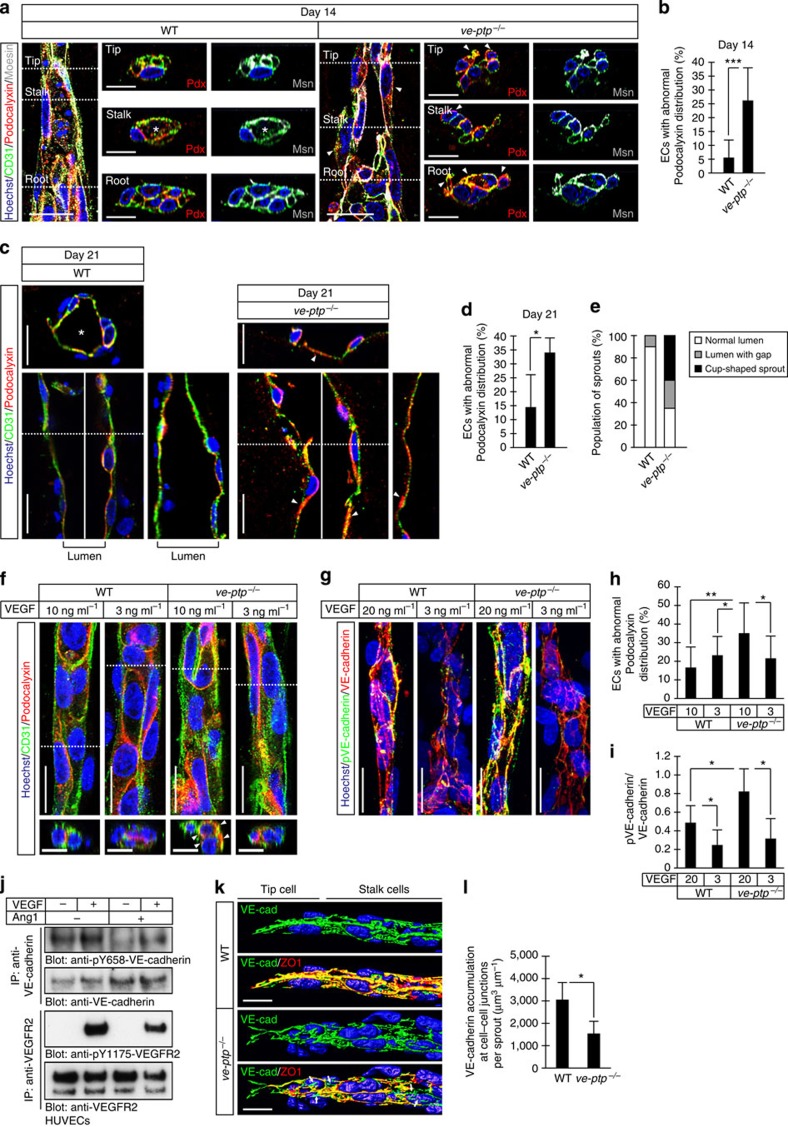
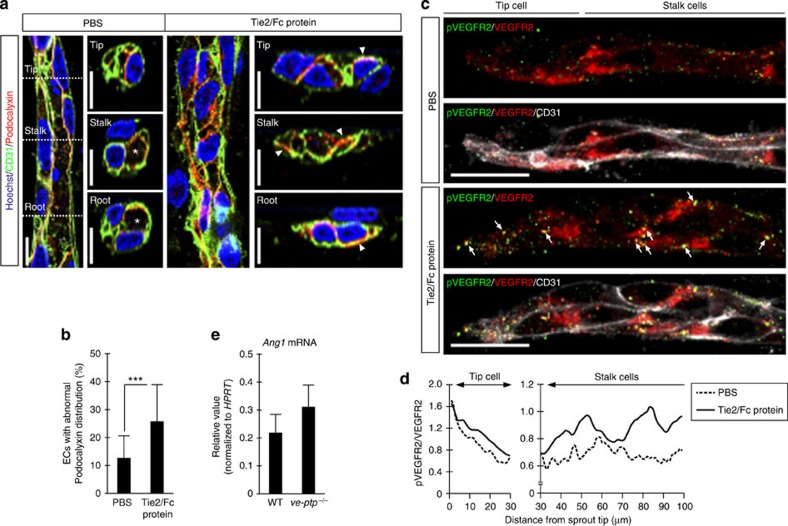
Vascular endothelial growth factor (VEGF) guides the path of new vessel sprouts by inducing VEGF receptor-2 activity in the sprout tip. In the stalk cells of the sprout, VEGF receptor-2 activity is downregulated. Here, we show that VEGF receptor-2 in stalk cells is dephosphorylated by the endothelium-specific vascular endothelial-phosphotyrosine phosphatase (VE-PTP). VE-PTP acts on VEGF receptor-2 located in endothelial junctions indirectly, via the Angiopoietin-1 receptor Tie2. VE-PTP inactivation in mouse embryoid bodies leads to excess VEGF receptor-2 activity in stalk cells, increased tyrosine phosphorylation of VE-cadherin and loss of cell polarity and lumen formation. Vessels in ve-ptp(-/-) teratomas also show increased VEGF receptor-2 activity and loss of endothelial polarization. Moreover, the zebrafish VE-PTP orthologue ptp-rb is essential for polarization and lumen formation in intersomitic vessels. We conclude that the role of Tie2 in maintenance of vascular quiescence involves VE-PTP-dependent dephosphorylation of VEGF receptor-2, and that VEGF receptor-2 activity regulates VE-cadherin tyrosine phosphorylation, endothelial cell polarity and lumen formation.


Figures

Figure 1
Figure 1. VEGFR2 stalk cell activity in ve-ptp−/− EBs.
WT and ve-ptp−/− EBs cultured in 3D collagen gels with VEGF (20 ng ml−1) until day 14, unless otherwise indicated. (a) Immunostaining of ECs (CD31; green) and pericytes (NG2; red) in WT and ve-ptp−/− EBs. Scale bars; 100μm. (b) Quantification of CD31-positive sprout area per EB. Mean±s.d., n=6 EBs per genotype. *P<0.05, t-test. (c) Quantification of sprout length, from core to sprout tip. Mean±s.d., n=100 sprouts per genotype. (d) Flow sorting of dissociated WT and ve-ptp−/− EBs (day 9; 2D culture) identified CD31 and VE-cadherin double-positive ECs. Mean±s.d., n=150 EBs per genotype. *P<0.05, t-test. (e) Detection of CD31-positive long (> 3 μm) filopodia (asterisk) per 100 μm EB sprout length. Mean±s.d., n=20 sprouts per genotype. ***P<0.001, t-test. (f) Representation of pY1175 VEGFR2 (upper) and VEGFR2 (middle) immunofluorescent staining using a 16-colour intensity scale. Merged image (bottom panel) shows pVEGFR2 (green), VEGFR2 (red) and CD31 (white). Scale bar; 20 μm. High-magnification insets show pVEGFR2; scale bar; 5 μm. (g) Ratio pVEGFR2/VEGFR2 fluorescent intensities per total CD31-area. Mean±s.d., n= 7 sprouts per genotype. The mean pVEGFR2/VEGFR2 ratio differed significantly between WT and ve-ptp−/− stalk cell region of the sprout; P<0.001 as determined using paired two-tailed t-test. (h) Vertical-view image of WT and ve-ptp−/− sprouts immunostained for pY1175 VEGFR2 (green), VEGFR2 (red) and CD31 (white). Arrows indicate pVEGFR2. Scale bars; 5 μm. (i) Immunostaining for VE-PTP (green) and CD31 (blue) in WT sprouts, show localization of VE-PTP in junctions (arrowheads) in the stalk region. Broken lines in the left, larger panel indicate position of vertical-view images shown in panels to the right. Scale bar; 20 μm. All analyses were repeated at least three times.
Figure 2
Figure 2. VE-PTP dephosphorylates VEGFR2 in a Tie2-dependent manner.
HEK 293 T cells, PAE/VEGFR2 or HUVECs treated as indicated with VEGF (20 ng ml−1, 15 min) or Ang1 (200 ng ml−1, 30 min) or VEGF+Ang1 (Ang 1, 200 ng ml−1, 15 min, followed by addition of VEGF 20 ng ml−1, 15 min). Analyses were performed by immunoblotting (blot) on total cell lysates or on immunoprecipitations (IPs) as indicated. All experiments were repeated at least twice. (a) HEK 293T cells expressing FLAG-tagged Tie2 (Tie2-FLAG) and WT or D/A mutant V5-tagged VE-PTP (VE-PTP-V5), treated with Ang1. (b) PAE/VEGFR2 cells expressing WT or D/A mutant VE-PTP-V5, treated with VEGF. (c) PAE/VEGFR2 cells expressing VE-PTP-V5 and Tie2-FLAG, treated with VEGF and Ang1. (d) PAE/VEGFR2 cells expressing WT VE-PTP-V5, D/A VE-PTP-V5 and Tie2-FLAG, treated with VEGF and Ang1. (e) HUVECs transfected with control or VE-PTP siRNAs, treated with VEGF and Ang1. Quantification of pVEGFR/VEGFR2 levels (right). (f) HUVECs transfected with control or Tie2 siRNAs, treated with VEGF. (g) HUVECs transfected with control siRNA or with two different Tie1 siRNAs (#1 and #2), and treated with VEGF. Samples were run on the same gel/blot. (h) PAE/VEGFR3 cells expressing VE-PTP-V5 and Tie2-FLAG, treated with 200 ng ml−1 VEGFC, for 15 min. (i) PAE/VEGFR2 cells expressing VE-PTP-V5 and Tie2-FLAG (Tie2-F), treated with VEGF and Ang1 individually and in combination. Sequential IP was performed first with anti-FLAG antibodies followed by low pH elution and re-IP with anti-V5 antibodies (resulting in VE-PTP enriched samples) as outlined to the upper right. The supernatants (VE-PTP-depleted samples) were used for re-IP with anti-VEGFR2 antibodies. Immunoblotting was performed of total cell lysates (Sample 1; left panel), VE-PTP-V5-enriched samples (Sample 2; middle panel) and VE-PTP-depleted samples (Sample 3; right panel). For the VE-PTP enriched and depleted samples, lanes 1–5 show the results of IP with specific antibodies; control IgG was used for IP of sample 6.
Figure 3
Figure 3. Level of VEGFR2 phosphorylation is dependent on junctions.
(a) HUVECs were pretreated with 200 ng ml−1 of Ang1 (30 min), followed by addition of VEGF (20 ng ml−1, 5 min), alternatively the two ligands were used individually (Ang1 for 30 min and VEGF for 5 min). Cells were immunostained with antibodies against VEGFR2 and Tie2. Scale bars, 20 μm. High-magnification insets show VEGFR2 and Tie2 in merged images; scale bars, 5 μm. (b) Quantification of the junctional/cytoplasmic ratio of VEGFR2 (upper) or Tie2 (lower) intensities in a; mean±s.d., n= 40–50 cells for each condition. **P<0.01. ***P<0.001, t-test. (c) Sparse and confluent HUVECs were treated with 200 ng ml−1 of Ang1 (30 min), 20 ng ml−1 of VEGF (15 min), individually or in combination, followed by immunoprecipitation (IP) with anti-VEGFR2 and blotting for pVEGFR2 and VEGFR2. Quantification of pVEGFR2/VEGFR2 is representative of three independent experiments.
Figure 4
Figure 4. Dephosphorylation of VEGFR2 at junctions.
(a) HUVECs transfected with control or ve-ptp siRNA were stimulated with VEGF (20 ng ml−1: 60 min), and with Ang1 (200 ng ml−1; 60 min) individually or in combination, followed by PLA for pVEGFR2/VEGFR2 complexes and immunostaining with anti-ZO1 antibodies (green) to visualize cell–cell junctions. Red dots represent PLA products. Scale bars, 10 μm. High-magnification insets show PLA products at junctions; scale bars; 5 μm. (b) Quantification of number of pVEGFR2/VEGFR2 PLA products per cell. Mean±s.d., n=45 cells per condition repeated twice. ***P<0.001, t-test. (c) Quantification of number of pVEGFR2/VEGFR2 PLA products at junctions per cell. Mean±s.d., n= 45 cells per condition repeated twice. *P<0.05, ***P<0.001, t-test. (d) HUVECs were treated with 200 ng ml−1 of Ang1 (30 min), followed by addition of 20 ng ml−1 of VEGF (5 min), alternatively the two ligands were used individually (Ang1 for 30 min and VEGF for 5 min), processed and subjected to PLA using antibodies against VEGFR2 and VE-PTP and immunostaining for ZO1 (green). Scale bars, 20 μm. High-magnification insets show VEGFR2/VE-PTP PLA spots at cell–cell junctions; scale bars, 10 μm. (e) Quantification of VEGFR2/VE-PTP PLA complexes per cell. Mean±s.d., n= 30 cells per condition. *P<0.05, t-test. (f) Quantification of VEGFR2/VE-PTP PLA complexes at junctions per cell. Mean±s.d., n=45 cells per condition repeated twice. **P<0.01, ***P<0.001, t-test. (g) VEGFR2/VE-PTP PLA was performed in HUVECs transfected with control and tie2 siRNA and treated with VEGF and Ang1 as in d, followed by PLA for VEGFR2/VE-PTP complexes, and immunostaining with anti-ZO1 antibodies. Scale bars, 20 μm. High-magnification insets show PLA products at junction; scale bars, 10 μm. (h) Quantification of VEGFR2/VE-PTP PLA complexes per cell. Mean±s.d., n= 100 cells per condition, repeated twice. **P<0.01, t-test.
Figure 5
Figure 5. VE-PTP is required for EC polarization and lumen formation.
Panels a, c, f, g and k show immunostaining of WT and ve-ptp−/− EBs at day 14 or 21, treated with 20 ng ml−1 of VEGF or, when indicated, 3 ng ml−1. Hoechst 33342 (blue) staining shows nuclei. Dashed lines show position of parallel vertical-view images. (a) Podocalyxin (Pdx; red), moesin (Msn; white), CD31 (green). Scale bars, 20 μm. Vertical-view images represent sprout tip, stalk and root; scale bars, 10 μm. Asterisk, lumen; arrowhead, abnormal podocalyxin distribution. (b) Quantification of ECs with abnormal podocalyxin per total ECs in a. Mean±s.d., n= 25 sprouts per genotype. ***P<0.001, t-test. (c) CD31 (green) and podocalyxin (red), show lumen in WT (asterisk) but cup-shaped ve-ptp−/− sprouts. Scale bars, 20 μm. (d) Quantification of abnormal podocalyxin/total CD31+ ECs in day 21 EBs. Mean±s.d.; n= 6 sprouts per genotype. *P<0.05, t-test. (e) Quantification of sprouts with continuous or discontinuous lumen and cup-shaped sprouts in the WT and ve-ptp−/− EBs. Mean±s.d.; n=10 sprouts/WT EBs and 20/ve-ptp−/− EBs. (f) CD31 (green) and podocalyxin (red) in EBs treated with different concentrations of VEGF. Arrowheads, abnormal podocalyxin distribution. Scale bars, 20 μm. (g) pY658 VE-cadherin (green) and VE-cadherin (red) in EBs treated with different concentrations of VEGF. Scale bars, 20 μm. (h) Quantification of ECs with abnormally localized podocalyxin in f. Mean±s.d.; n= 14–15 sprouts for each condition, *P<0.05, **P<0.01, t-test. (i) Quantification of pVE-cadherin/VE-cadherin in g. Mean±s.d.; n= 5–8 sprouts for each condition, *P<0.05, t-test. (j) HUVECs treated individually with VEGF, Ang1 or VEGF+Ang1, immunoprecipitation (IP) of VE-cadherin and VEGFR2, and immunoblotting for pY658 VE-cadherin, VE-cadherin, pY1175 VEGFR2 and VEGFR2. (k) WT and ve-ptp−/− EBs at day 14 represented by 3D Imaris images show VE-cadherin (VE-cad; green) and ZO1 (red). Arrows, fragmented VE-cadherin. Scale bars, 20 μm. (l) Quantification of VE-cadherin colocalized with ZO1 per 100 μm sprout length. Mean±s.d. n=4 sprouts for each condition. *P<0.05, t-test.
Figure 6
Figure 6. Tie2 is required in VE-PTP-mediated VEGFR2 dephosphorylation.
(a) WT EBs in 3D collagen with VEGF (20 ng ml−1) in the presence or absence of Tie2/Fc protein (4 μg ml−1) show CD31 (green), podocalyxin (red) and Hoechst 33342 (blue). Dashed lines show position of vertical-view images displayed in panels labelled tip, stalk and root. Scale bars, 10 μm. Asterisk, lumen; arrowhead, abnormal podocalyxin distribution. (b) Quantification of ECs with abnormal podocalyxin distribution. Mean±s.d., n= 20 sprouts per condition. ***P<0.001, t-test. (c) pVEGFR2 (green), VEGFR2 (red) and CD31 (white) at day 14 in WT EBs treated or not with Tie2/Fc protein (4 μg ml−1). Arrows indicate pVEGFR2. Scale bars; 20 μm. (d) Ratio of pVEGFR2/VEGFR2 intensities from sprout tip to stalk. Data show the mean; n= 8 sprouts/condition. (e) Ang1 transcript expression/HPRT expression in WT and ve-ptp−/− EBs in 2D collagen with VEGF (20 ng ml−1) at day 14. Mean±s.d. Statistics are based on two independent experiments with n=150 EBs per experiment.
Figure 7
Figure 7. VE-PTP regulates VEGFR2 activity and polarization in vivo.
(a) WT and ve-ptp−/− teratoma sections show CD31 (green), podocalyxin (red) and Hoechst 33342 (blue). Asterisk, lumen. Scale bars, 20 μm. (b) Podocalyxin intensity/CD31-positive area (mm3) in a. Mean±s.d.; n= 15 CD31-positive vessels of 50 μm length/3 teratomas/genotype. *P<0.05, t-test. (c) WT and ve-ptp−/− teratoma sections. Left: 16-colour intensity scale representation of pVEGFR2 immunostaining. Right: Hoechst 33342 (blue), pY1175 VEGFR2 (green), and CD31 (grey). Scale bars, 20 μm. (d) pY1175 VEGFR2 intensity/CD31-positive area (mm2) in c. Mean±s.d.; n= 12 (WT) and 15 (ve-ptp−/−) blood vessels of 30 μm length from 3 teratomas per genotype. **P<0.01, t-test. (e) Lectin-perfused WT and ve-ptp−/− teratomas. Hoechst 33342 (blue), lectin-FITC (green), pY1175 VEGFR2 (red) and VE-PTP (white). Right: control immunostaining without primary antibodies. Asterisk, lumen. Arrows show VE-PTP expression in WT teratomas. Arrowheads show pVEGFR2 in ve-ptp−/− teratomas. Scale bars, 20 μm. (f) Lectin-perfused WT and ve-ptp−/− teratomas show lectin-FITC (green), VE-cadherin (red) and VE-PTP (white). Asterisk, lumen. Arrowheads in the lower ve-ptp−/− panel indicate fragmented VE-cadherin immunostaining. Scale bars, 20 μm. (g) Lectin-perfused B16 F10 mouse melanomas show lectin-FITC (green), VE-cadherin (VE-cad; red) and VE-PTP (white). Asterisk, lumen. Arrowheads in the lower panel indicate fragmented VE-cadherin immunostaining. Scale bars, 20 μm. (h) Model illustrating the contribution of VE-PTP in silencing VEGFR2 and Tie2 at junctions to support proper EC polarity and vessel morphogenesis. VE-PTP exists in complex with VEGFR2 and Tie2 in the WT condition (left). VEGF induces activation of VEGFR2 and in parallel, dissociation from VE-PTP. VEGF and Ang1 induce translocation of the trimeric complex to junctions where the activated receptors are silenced by VE-PTP. This is compatible with formation of polarized and lumenized vessels. In the VE-PTP-deficient condition (ve-ptp−/−; right), VEGF and Ang1 induce activation and translocation of receptors to junctions, where excess activity leads to VE-cadherin phosphorylation and formation of unpolarized and lumen-less pathological vasculature.
Figure 8
Figure 8. Zebrafish ptp-rb regulates ISV lumen formation.
(a) At 48 hours post fertilization, ptp-rb MO ISVs migrate and anastomose to make a DLAV, but lack patent lumens and are covered with filopodia compared with control MO-treated embryos. Scale bars, 10 μm. (b) Transverse optical sections show lumen in control MO-treated ISV (asterisk), whereas ptp-rb MO ISV lacks a lumen. Scale bars, 10 μm. (c) ISV lumen defects per embryo. Mean±s.d., n=12 (control MO) and 10 (ptp-rb MO) embryos. ***P<0.001, t-test. (d) Close-up view of the ptp-rb MO hyperfilopodial phenotype. Scale bars, 10 μm. (e) Quantification of number of filopodia per 10 μm. Mean±s.d.; n= 4 (control MO) and 7 (ptp-rb MO) ISVs. **P<0.01, t-test. (f) Podocalyxin (Pdxl; red) in control and ptp-rb MO-treated embryos. Upper, middle and lower panels show overviews, high-magnification and transvere images of ISVs, respectively. Asterisk, lumen; arrows indicate Podocalyxin mislocalization. Scale bars, 10 μm. (g) VE-cadherin (Cdh5; red) in ISVs (upper) in control and ptp-rb MO-treated embryos. Lower panels show transverse images of ISVs. Blood vessels are defined by fli-1 promoter-driven GFP (green) in f and g. Scale bars, 10 μm.

References

    1. Nagy J. A., Benjamin L., Zeng H., Dvorak A. M. & Dvorak H. F.. Vascular permeability, vascular hyperpermeability and angiogenesis. Angiogenesis 11, 109–119 (2008) . - PMC - PubMed
    1. Koch S., Tugues S., Li X., Gualandi L. & Claesson-Welsh L.. Signal transduction by vascular endothelial growth factor receptors. Biochem. J. 437, 169–183 (2011) . - PubMed
    1. Carmeliet P. et al.. Abnormal blood vessel development and lethality in embryos lacking a single VEGF allele. Nature 380, 435–439 (1996) . - PubMed
    1. Ferrara N. et al.. Heterozygous embryonic lethality induced by targeted inactivation of the VEGF gene. Nature 380, 439–442 (1996) . - PubMed
    1. Shalaby F. et al.. Failure of blood-island formation and vasculogenesis in Flk-1-deficient mice. Nature 376, 62–66 (1995) . - PubMed

Publication types

MeSH terms

Substances