. 2013 Apr 10;33(15):6267-77.
doi: 10.1523/JNEUROSCI.5599-12.2013.

Angiotensin II modulates salty and sweet taste sensitivities

Affiliations

Angiotensin II modulates salty and sweet taste sensitivities

Noriatsu Shigemura et al. J Neurosci. .

Abstract

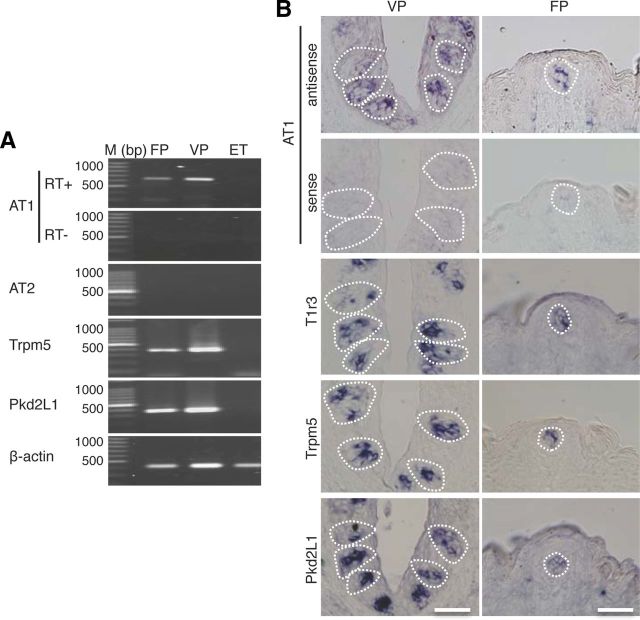
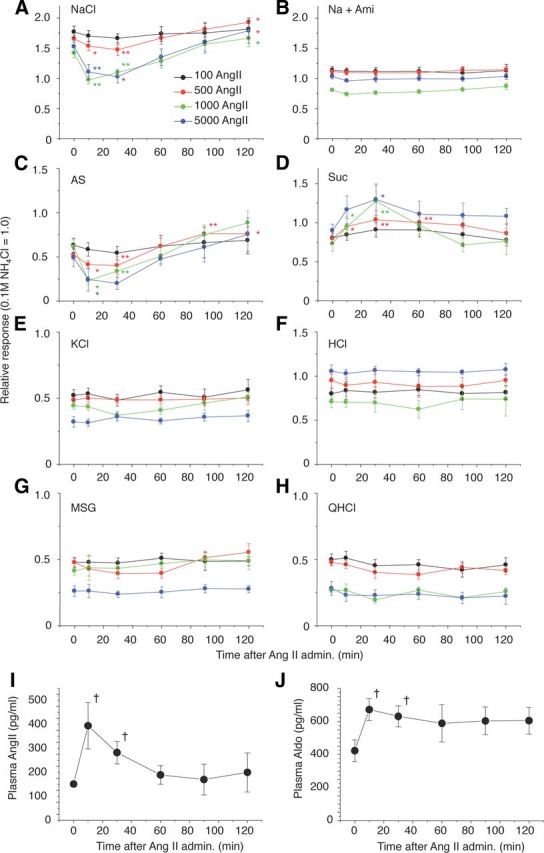
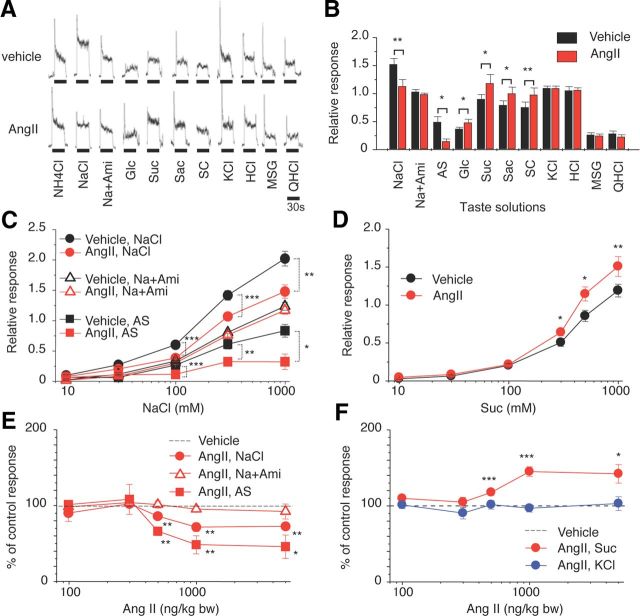
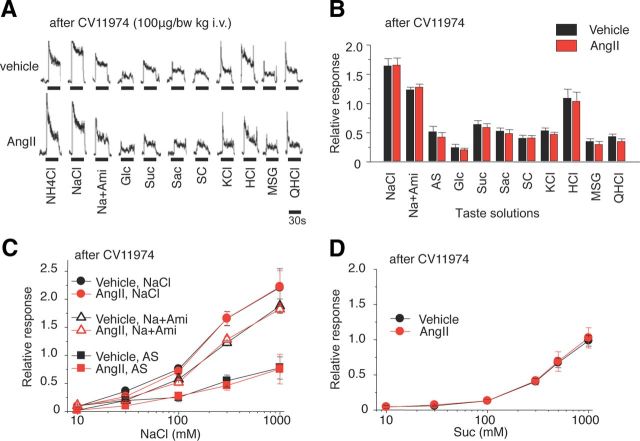
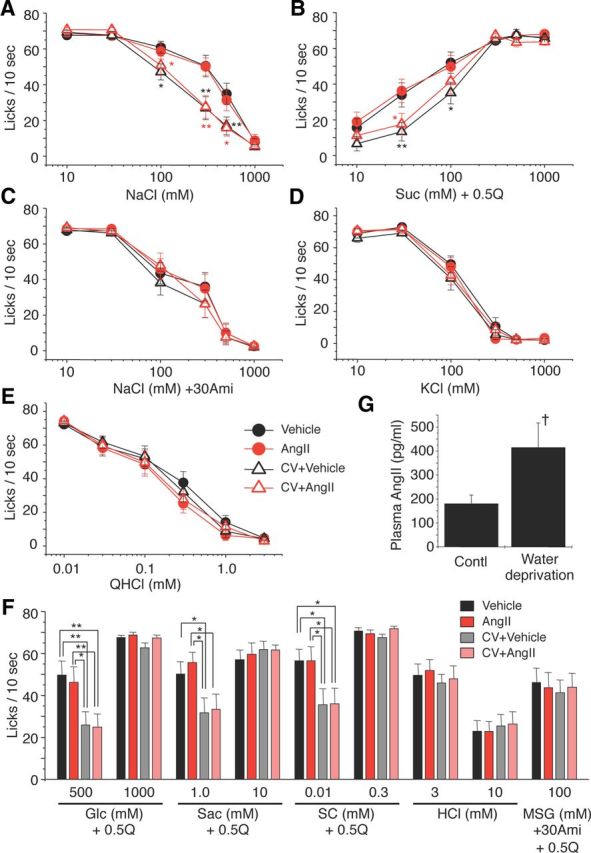
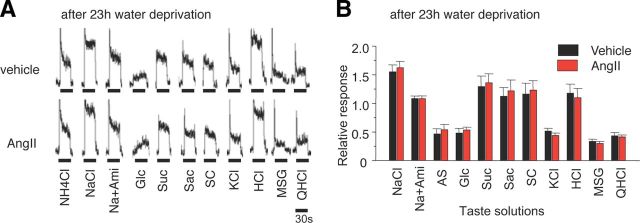
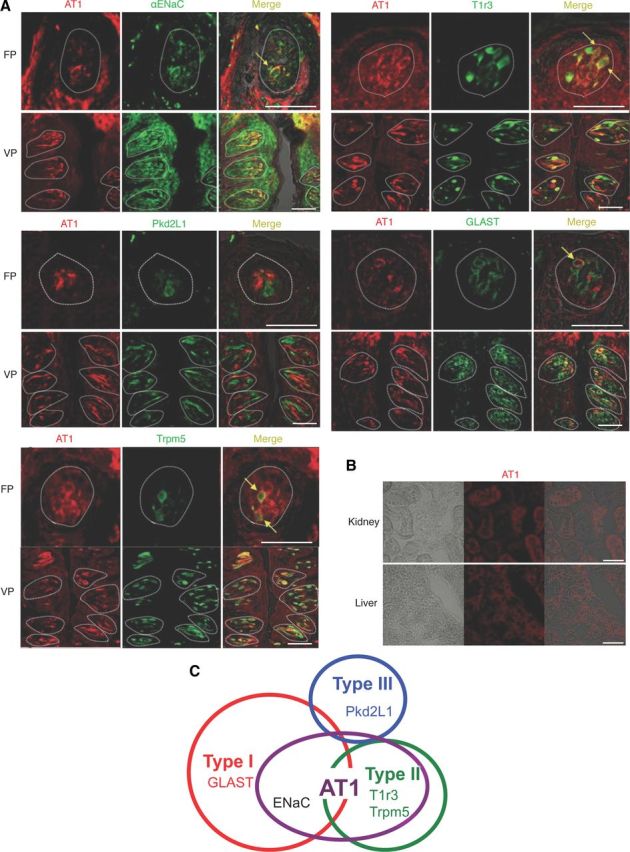
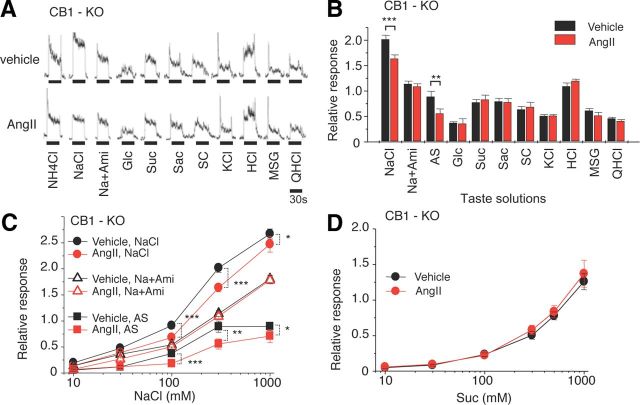
Understanding the mechanisms underlying gustatory detection of dietary sodium is important for the prevention and treatment of hypertension. Here, we show that Angiotensin II (AngII), a major mediator of body fluid and sodium homeostasis, modulates salty and sweet taste sensitivities, and that this modulation critically influences ingestive behaviors in mice. Gustatory nerve recording demonstrated that AngII suppressed amiloride-sensitive taste responses to NaCl. Surprisingly, AngII also enhanced nerve responses to sweeteners, but had no effect on responses to KCl, sour, bitter, or umami tastants. These effects of AngII on nerve responses were blocked by the angiotensin II type 1 receptor (AT1) antagonist CV11974. In behavioral tests, CV11974 treatment reduced the stimulated high licking rate to NaCl and sweeteners in water-restricted mice with elevated plasma AngII levels. In taste cells AT1 proteins were coexpressed with αENaC (epithelial sodium channel α-subunit, an amiloride-sensitive salt taste receptor) or T1r3 (a sweet taste receptor component). These results suggest that the taste organ is a peripheral target of AngII. The specific reduction of amiloride-sensitive salt taste sensitivity by AngII may contribute to increased sodium intake. Furthermore, AngII may contribute to increased energy intake by enhancing sweet responses. The linkage between salty and sweet preferences via AngII signaling may optimize sodium and calorie intakes.


Figures

Figure 1.
Figure 1.
AngII type1 receptor (AT1) mRNA is expressed in mouse taste bud cells. A, RT-PCR amplification of AT1, AT2, Trpm5, Pkd2L1, and β-actin mRNAs from FP, VP, and tongue epithelium devoid of taste cells (ET). RT+ and RT− conditions are, respectively, with and without reverse transcriptase. M, 100 bp marker ladder. B, ISH detection of AT1, T1r3, Trpm5, and Pkd2L1 in FP and VP of B6 mice. The sense probe for AT1 serves as a negative control. Dotted lines indicate the outline of taste buds. Scale bar, 50 μm.
Figure 2.
Figure 2.
Time-dependent changes in CT nerve responses to (A) 300 mm NaCl; (B) 300 mm NaCl + 30 μm amiloride (Na + Ami); (C) AS (amiloride-sensitive component: obtained by subtracting Na + Ami from NaCl); (D) 500 mm Suc; (E) 100 mm KCl; (F) 10 mm HCl; (G)100 mm MSG + 30Ami (MSG); and (H) 20 mm QHCl 0 and 10, 30, 60, 90, and 120 min after administration of 100–5000 ng/kg bw of AngII in B6 mice. I, J, Time-dependent changes in plasma AngII and Aldo after administration of 5000 ng/kg bw of AngII in B6 mice. Asterisks indicate significant differences from control (0 min) (n = 6–14, *p < 0.05, **p < 0.01; paired t test, p < 0.05; t test). All data are presented as the mean ± SEM.
Figure 3.
Figure 3.
AngII reduces CT nerve responses to NaCl (amiloride-sensitive component) and enhances responses to sweeteners. A, Typical examples of CT nerve responses of B6 mice 30 min after intraperitoneal injection of 1000 ng/kg bw of AngII (lower traces) versus vehicle-injected controls (upper traces). B, CT nerve responses (normalized to 100 mm NH4Cl) of B6 mice stimulated by indicated compounds 10–30 min after administration of vehicle (black bars) or 1000 ng/kg bw of AngII (red bars) (n = 7–17). Compounds tested: NaCl [300 mm NaCl]; Na + Ami [300 mm NaCl + 30 μm amiloride]; AS, the amiloride-sensitive NaCl component (obtained by subtracting Na + Ami from NaCl); Glc [500 mm glucose]; Suc [500 mm sucrose]; Sac [20 mm saccharin]; SC [1 mm SC45647]; KCl [100 mm KCl]; HCl [10 mm HCl]; MSG [100 mm monosodium glutamate + 30 Ami]; and QHCl [20 mm quinine HCl]. C, Concentration dependence of CT responses to NaCl, NaCl + Ami, and AS 10–30 min after administration of vehicle (black symbols) or 1000 ng/kg bw of AngII (red symbols) (n = 5–12). D, Concentration-dependent CT responses to sucrose 10–30 min after administration of vehicle (black symbols) or 1000 ng /kg bw of AngII (red symbols) (n = 12). E, Dose-dependent effect of AngII treatment on CT responses to 300 mm NaCl, 300 mm Na + 30 μm Ami, and 300 mm AS (n = 6–13; see Fig. 2 for details) (in each case the response magnitude to 300 mm NaCl, 300 mm Na + 30 μm Ami, or 300 mm AS after administration of vehicle control were normalized to be 100%). F, Dose-dependent effect of AngII treatment on CT nerve responses to 500 mm Suc and 100 mm KCl (n = 7–15) (in both cases the response magnitude to 500 mm Suc or 100 mm KCl after administration of vehicle control were normalized to be 100%). Asterisks indicate significant differences between AngII treatments and vehicle controls [*p < 0.05; **p < 0.01; ***p < 0.001; paired t test (B), post hoc t test following repeated two-way ANOVA (C–F)]. All data are presented as the mean ± SEM.
Figure 4.
Figure 4.
AT1 antagonist, CV11974, blocks the effects of AngII on gustatory nerve responses to NaCl (amiloride-sensitive component) and sweeteners. A, Typical examples of CT nerve responses of B6 mice pretreated with 100 μg/kg bw of CV11974 (i.v.) 30 min after intraperitoneal injection of 1000 ng/kg bw of AngII (lower traces) versus vehicle-injected controls (upper traces). B, After CV11974 treatment, CT nerve responses (normalized to 100 mm NH4Cl) of B6 mice stimulated by salty [NaCl, 300 mm NaCl; Na + Ami, 300 mm NaCl + 30 μm amiloride; AS, amiloride-sensitive component (obtained by subtracting Na + Ami from NaCl); KCl, 100 mm KCl], sweet (Glc, 500 mm glucose; Suc, 500 mm sucrose; Sac, 20 mm saccharin; SC, 1 mm SC45647), sour (HCl, 10 mm HCl), umami (MSG, 100 mm monosodium glutamate + 30Ami), and bitter (QHCl, 20 mm quinine-HCl) compounds 10–30 min after administration of vehicle as control (black bars) or 1000 ng /kg bw of AngII (red bars) (n = 5–8). C, D, Concentration dependence of CT responses to NaCl, Na + Ami, AS, and Suc 10–30 min after administration of vehicle (black symbols) or 1000 ng/kg bw of AngII (red symbols) with pretreatment of 100 μg/kg bw of CV11974 (n = 5–8). Significant differences were not detected from control [paired t test (B), repeated two-way ANOVA (C, D)]. All data are presented as the mean ± SEM.
Figure 5.
Figure 5.
The AT1 antagonist CV11974 modulates behavioral responses to NaCl (amiloride-sensitive component) and sweeteners. Concentration-dependent lick responses to (A) NaCl, (B) Suc + 0.5Q (sucrose + 0.5 mm QHCl mixture), (C) NaCl + 30Ami (30 μm amiloride), (D) KCl, and (E) QHCl 10–30 min after administration of vehicle (black circles), 5000 ng/kg bw of AngII (red circles), vehicle after pretreatment with 100 μg/kg bw of CV11974 (CV + Vehicle, black triangles), and 5000 ng/kg bw of AngII after pretreatment with 100 μg/kg bw of CV11974 (CV + AngII, red triangles) (n = 17 each). In A and B, black asterisks indicate significant differences between Vehicle and CV + Vehicle. Red asterisks indicate significant differences between AngII and CV + AngII. F, Lick responses to other taste stimuli: Glc (glucose) + 0.5Q (n = 17 each), Sac (saccharin) + 0.5Q (n = 15–17), SC (SC45647) + 0.5Q (n = 14–17), HCl (n = 17 each), MSG + 30Ami + 0.5Q (n = 17 each) 10–30 min after administration of vehicle (black bars), AngII (red bars), CV + Vehicle (gray bars), and CV + AngII (pink bars). G, Endogenous plasma AngII before and after 23 h water deprivation (n = 6 each). Asterisks indicate significant differences (*p < 0.05; **p < 0.01; post hoc t test following repeated two-way ANOVA, p < 0.05; t test). All data are presented as the mean ± SEM.
Figure 6.
Figure 6.
Twenty-three hour water-deprived B6 mice show no effects of AngII on gustatory nerve responses to NaCl (amiloride-sensitive component) and sweeteners. A, Typical examples of CT nerve responses of 23 h water-deprived B6 mice 30 min after intraperitoneal injection of 1000 ng/kg bw of AngII (lower traces) versus vehicle-injected controls (upper traces). B, CT nerve responses (normalized to 100 mm NH4Cl) of water-deprived B6 mice stimulated by salty [NaCl, 300 mm NaCl; Na + Ami, 300 mm NaCl + 30 μm amiloride; AS, amiloride-sensitive component (obtained by subtracting Na + Ami from NaCl); KCl, 100 mm KCl], sweet (Glc, 500 mm glucose; Suc, 500 mm sucrose; Sac, 20 mm saccharin; SC, 1 mm SC45647), sour (HCl, 10 mm HCl), umami (MSG, 100 mm monosodium glutamate + 30 Ami), and bitter (QHCl, 20 mm quinine-HCl) compounds 10–30 min after administration of vehicle as control (black bars) or 1000 ng /kg bw of AngII (red bars) (n = 6 each). Significant differences were not detected from control (p > 0.1, paired t test). All data are presented as the mean ± SEM.
Figure 7.
Figure 7.
Coexpression in taste bud cells of AT1, αENaC, and T1r3. A, Coexpression in FP and VP of B6, T1r3-GFP, or Trpm5-GFP mice of AT1 with αENaC (upper left set), T1r3 (upper right set), Pkd2L1 (middle left set), GLAST (middle right set), or Trpm5 (lower left set). Immunostaining for AT1 is shown in red. Immunostaining for αENaC, Pkd2L1, GLAST, or GFP fluorescence of T1r3 and Trpm5 expression are shown in green. Arrows indicate AT1-expressing taste cells that coexpress αENaC, T1r3, GLAST, or Trpm5 in FP. Dotted lines indicate the outline of taste buds. Scale bar, 50 μm. B, The signals for AT1 proteins are detected in hepatocytes of liver and in proximal tubule cells of kidney as described previously (Gasc et al., 1994). C, Summary of the coexpression patterns among AT1, taste receptors, and taste cell markers in FP and VP of mice.
Figure 8.
Figure 8.
Sweet enhancing effect of AngII on gustatory nerve responses to sweeteners is mediated by cannabinoid receptor CB1. A, Typical examples of CT nerve responses of CB1-KO mice 30 min after intraperitoneal injection of 5000 ng/kg bw of AngII (lower traces) versus vehicle-injected control (upper traces). B, CT nerve responses (normalized to 100 mm NH4Cl) of CB1-KO mice stimulated by salty [NaCl, 300 mm NaCl; Na + Ami, 300 mm NaCl + 30 μm amiloride; AS, amiloride-sensitive component (obtained by subtracting Na + Ami from NaCl); KCl, 100 mm KCl], sweet (Glc, 500 mm glucose; Suc, 500 mm sucrose; Sac, 20 mm saccharin; SC, 1 mm SC45647), sour (HCl, 10 mm HCl), umami (MSG, 100 mm monosodium glutamate + 30 μm Ami), and bitter (QHCl, 20 mm quinine-HCl) compounds 10–30 min after administration of vehicle (black bars) or 5000 ng/kg bw of AngII (red bars) (n = 11–16). C, D, Concentration dependence of CT responses to NaCl, Na + Ami, AS, and Suc 10–30 min after administration of vehicle (black symbols) or 5000 ng/kg bw of AngII (red symbols) in CB1-KO mice (n = 8–16). Asterisks indicate significant differences from control [*p < 0.05; **p < 0.01; ***p < 0.001; paired t test (B), post hoc t test following repeated two-way ANOVA (C)]. All data are presented as the mean ± SEM.

References

    1. Abaffy T, Trubey KR, Chaudhari N. Adenylyl cyclase expression and modulation of cAMP in rat taste cells. Am J Physiol Cell Physiol. 2003;284:C1420–C1428. - PubMed
    1. Aguilera G, Hauger RL, Catt KJ. Control of aldosterone secretion during sodium restriction: adrenal receptor regulation and increased adrenal sensitivity to angiotensin II. Proc Natl Acad Sci U S A. 1978;75:975–979. doi: 10.1073/pnas.75.2.975. - DOI - PMC - PubMed
    1. Avrith DB, Fitzsimons JT. Increased sodium appetite in the rat induced by intracranial administration of components of the renin–angiotensin system. J Physiol. 1980;301:349–364. - PMC - PubMed
    1. Billet S, Bardin S, Verp S, Baudrie V, Michaud A, Conchon S, Muffat-Joly M, Escoubet B, Souil E, Hamard G, Bernstein KE, Gasc JM, Elghozi JL, Corvol P, Clauser E. Gain-of-function mutant of angiotensin II receptor, type 1A, causes hypertension and cardiovascular fibrosis in mice. J Clin Invest. 2007;117:1914–1925. doi: 10.1172/JCI28764. - DOI - PMC - PubMed
    1. Chandrashekar J, Hoon MA, Ryba NJ, Zuker CS. The receptors and cells for mammalian taste. Nature. 2006;444:288–294. doi: 10.1038/nature05401. - DOI - PubMed

Publication types

MeSH terms