. 2013 Apr 10;33(15):6343-9.
doi: 10.1523/JNEUROSCI.4997-12.2013.

Mapping brain metabolic connectivity in awake rats with μPET and optogenetic stimulation

Affiliations

Mapping brain metabolic connectivity in awake rats with μPET and optogenetic stimulation

Panayotis K Thanos et al. J Neurosci. .

Abstract

Positron emission tomography (PET) with [(18)F]2-fluoro-2-deoxy-D-glucose was used to measure changes in regional brain glucose metabolism (BGluM) in response to optogenetic stimulation (using the excitatory channelrhodopsin-2) of the nucleus accumbens (NAc) in awake rats. We demonstrated not only increases in BGluM that correlated with c-Fos expression in the region of stimulation, but also BGluM increases in the ipsilateral striatum, periaqueductal gray, and somatosensory cortex, and in contralateral amygdala, ventral pallidum, globus pallidus, and hippocampus, as well as decreases in BGluM in regions of the default mode network (retrosplenial cortex and cingulate gyrus) and secondary motor cortex. Additional exploration of c-Fos expression in regions found to be activated by PET results found corroborating evidence, with increased c-Fos expression in the ipsilateral somatosensory cortex, contralateral amygdala and globus pallidus, and bilateral periaqueductal gray. These findings are consistent with optogenetic excitation of the area of stimulation (NAc), as well as with stimulatory and inhibitory effects on downstream regions. They also confirm the utility of PET imaging to monitor connectivity in the awake rodent brain.


Figures

Figure 1.
Figure 1.
FDG scanning protocol.
Figure 2.
Figure 2.
μPET and statistical parametric mapping (SPM8) results from the ChR2 group coregistered to the Schweinhardt MRI template. Red, Stimulation > Baseline (Excitation); Blue, Baseline > Stimulation (Inhibition). p < 0.005; Ke > 100; T > 5.72. Location of coronal sections shown from sagittal view on the right, numbered respectively. Sagittal reference image on the right adapted to show location of corresponding numbered coronal plates (Paxinos and Watson, 2007). Regions labeled represent regions encompassed by the span of the respective cluster. Cg1, Cingulate gyrus, area 1; CPu, caudate–putamen; VP, ventral pallidum; S2, secondary somatosensory cortex; Amyg, amygdala; RSA, retrosplenial cortex; dHP, dorsal hippocampus; st, stria terminalis.
Figure 3.
Figure 3.
A, Individual metabolic values in NAc and correlation with cFOS. Brain glucose metabolism (BGluM) in the NAc during the baseline (BL) and stimulation (STIM) scans in GFP (left) and ChR2 (right) rats. A ROI was drawn around the SPM cluster in the NAc that was shown to be significantly activated following OGS in the ChR2 group, and activity in this ROI was normalized to whole-brain activity during baseline and stimulation for both groups of rats. Each dot represents a data value for one animal. All ChR2 rats had greater activity in the NAc in the stimulation scan compared with the baseline scan, and this increase between scans was statistically significant for the ChR2 group only (**p < 0.01). Additionally, ChR2 rats had greater BGluM in the NAc ROI during the stimulation scan compared with GFP rats (**p < 0.01). B, Correlation between c-Fos expression following stimulation and percent change in BGluM from baseline to stimulation scans. There was a statistically significant positive association between c-Fos expression in the NAc following stimulation and percent change in BGluM in the NAc from baseline to stimulation scans (r = 0.7721, **p < 0.01).
Figure 4.
Figure 4.
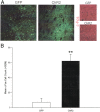
Rats were optogenetically stimulated in the NAc for 10 min, then perfused 90 min later and their brains harvested. Immunohistochemistry was performed to visualize and quantify c-Fos expression in the nucleus accumbens following stimulation. A, Immunolabeling of c-Fos expression following optogenetic stimulation in GFP and ChR2 rats. B, Quantification of c-Fos expression following optogenetic stimulation in GFP and ChR2 rats. ChR2 rats showed significantly greater c-Fos expression compared with GFP rats (**p < 0.01).
Figure 5.
Figure 5.
Quantification of c-Fos immunolabeling in regions found to be significantly activated (from μPET results) following optogenetic stimulation of the NAc. Rats were optogenetically stimulated in the NAc for 10 min, then perfused 90 min later and their brains harvested. Immunohistochemistry was performed to visualize and quantify c-Fos expression in the contralateral and ipsilateral secondary somatosensory cortex (S2), amygdala, GP, and PAG following stimulation. ChR2 rats showed significantly greater c-Fos expression compared with GFP rats in the ipsilateral S2 (****p < 0.0001), contralateral amygdala (**p < 0.01), and GP (***p < 0.001), as well as the ipsilateral (***p < 0.001) and contralateral (**p < 0.01) PAG.
Figure 6.
Figure 6.
Locomotor activity during habituation and μPET scans. Locomotor activity was measured during three habituation (Hab) sessions, as well as during the period of FDG uptake immediately preceding baseline and stimulation μPET scans. During all habituation and μPET scan locomotor activity assessment periods, rats were attached to the optical fiber (light turned on for stimulation scan only) and locomotor activity was restricted by placement in a small holding cage. Rats were more active in the habituation sessions compared with the sessions before μPET scans (***p < 0.05).

References

    1. Adamantidis A, Carter MC, de Lecea L. Optogenetic deconstruction of sleep-wake circuitry in the brain. Front Mol Neurosci. 2010;2:31. - PMC - PubMed
    1. Apostolova I, Block S, Buchert R, Osen B, Conradi M, Tabrizian S, Gensichen S, Schröder-Hartwig K, Fricke S, Rufer M, Weiss A, Hand I, Clausen M, Obrocki J. Effects of behavioral therapy or pharmacotherapy on brain glucose metabolism in subjects with obsessive-compulsive disorder as assessed by brain FDG PET. Psychiatry Res. 2010;184:105–116. doi: 10.1016/j.pscychresns.2010.08.012. - DOI - PubMed
    1. Arai N, Yokochi F, Ohnishi T, Momose T, Okiyama R, Taniguchi M, Takahashi H, Matsuda H, Ugawa Y. Mechanisms of unilateral STN-DBS in patients with Parkinson's disease: a PET study. J Neurol. 2008;255:1236–1243. doi: 10.1007/s00415-008-0906-7. - DOI - PubMed
    1. Boyden ES, Zhang F, Bamberg E, Nagel G, Deisseroth K. Millisecond-timescale, genetically targeted optical control of neural activity. Nat Neurosci. 2005;8:1263–1268. doi: 10.1038/nn1525. - DOI - PubMed
    1. Cardin JA, Carlén M, Meletis K, Knoblich U, Zhang F, Deisseroth K, Tsai LH, Moore CI. Targeted optogenetic stimulation and recording of neurons in vivo using cell-type-specific expression of Channelrhodopsin-2. Nat Protoc. 2010;5:247–254. doi: 10.1038/nprot.2009.228. - DOI - PMC - PubMed

Publication types

MeSH terms

LinkOut - more resources