. 2013 Apr 10;33(15):6454-9.
doi: 10.1523/JNEUROSCI.0178-13.2013.

Opioid modulation of ventral pallidal afferents to ventral tegmental area neurons

Affiliations

Opioid modulation of ventral pallidal afferents to ventral tegmental area neurons

Gregory O Hjelmstad et al. J Neurosci. .

Abstract

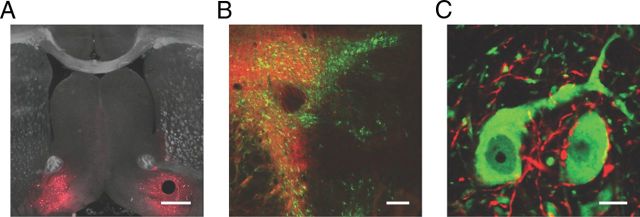
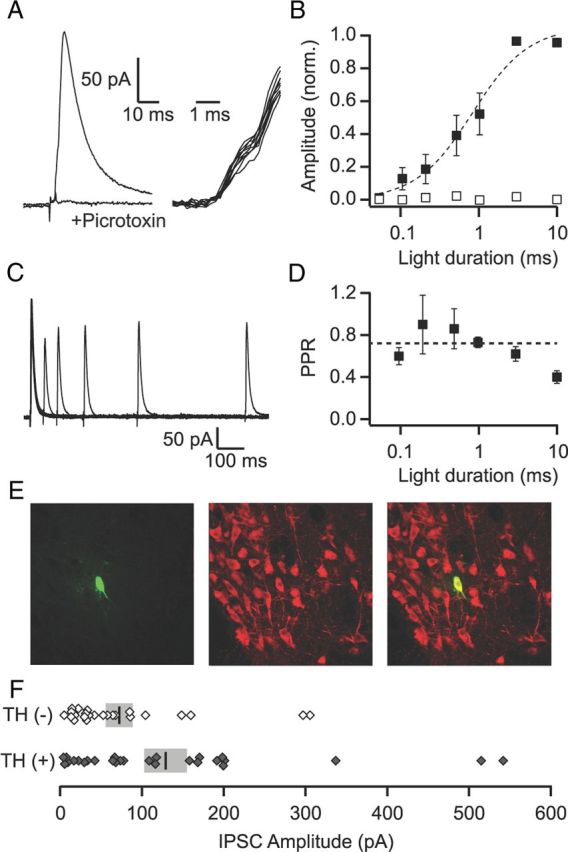
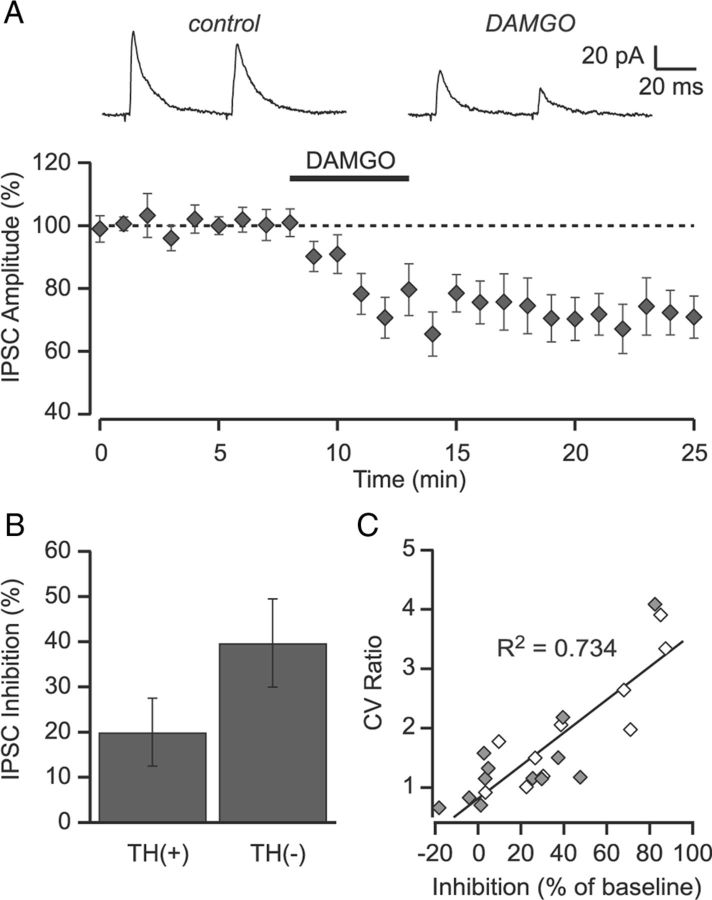
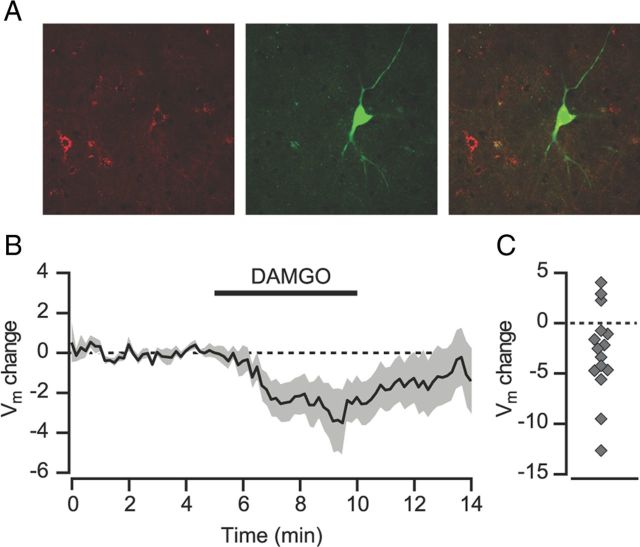
Activation of mu opioid receptors within the ventral tegmental area (VTA) can produce reward through the inhibition of GABAergic inputs. GABAergic neurons in the ventral pallidum (VP) provide a major input to VTA neurons. To determine the specific VTA neuronal targets of VP afferents and their sensitivity to mu opioid receptor agonists, we virally expressed channel rhodopsin (ChR2) in rat VP neurons and optogenetically activated their terminals in the VTA. Light activation of VP neuron terminals elicited GABAergic IPSCs in both dopamine (DA) and non-DA VTA neurons, and these IPSCs were inhibited by the mu opioid receptor agonist DAMGO. In addition, using a fluorescent retrograde marker to identify VTA-projecting VP neurons, we found them to be hyperpolarized by DAMGO. Both of these actions decrease GABAergic input onto VTA neurons, revealing two mechanisms by which endogenous or exogenous opioids can activate VTA neurons, including DA neurons.


Figures

Figure 1.
Figure 1.
Ventral pallidal projections to the VTA. A, Coronal section showing bilateral expression of ChR2 (red) at the injection site in the VP. Scale bar, 500 μm. B, Horizontal midbrain section showing ChR2-expressing VP fibers (red) projecting widely throughout the VTA and medial substantia nigra (TH immunocytochemical labeling shown in green). Scale bar, 200 μm. C, High-magnification section in the VTA showing ChR2-expressing axons (red) contacting DA neuron cell bodies (green). Scale bar, 10 μm.
Figure 2.
Figure 2.
VP inputs produce GABAA-mediated IPSCs onto VTA neurons. A, Left: Average of 10 consecutive light-evoked IPSCs recorded under control conditions and in the presence of picrotoxin (100 μm). Right: The individual IPSCs from the average shown on an expanded time scale (with the stimulus artifact subtracted out) indicate little trial-to-trial jitter in the onset of the current, which is consistent with a direct, monosynaptic input. B, IPSC amplitude as a function of light duration in control conditions (filled squares, n = 7) and in the presence of TTX (1 μm; open squares, n = 4). C, Overlay of averages (5 sweeps each) of pairs of light-evoked IPSCs at intervals of 50, 100, 200, 400, and 800 ms from an example recording. D, The PPR (50 ms interpulse interval) plotted as a function of the light duration. The dashed line is the average of across all durations. E, Example of a TH(+) neuron that showed a light-evoked response from the VP. Left: Biocytin fill (green); middle: TH (red); right: overlay. F, Distribution of evoked IPSC amplitudes for all identified TH(+) and TH(−) neurons. Vertical bars show mean amplitude for each group. SEM is shown in gray.
Figure 3.
Figure 3.
DAMGO inhibits light-evoked IPSCs. A, Bath application of the MOR agonist DAMGO (1 μm) inhibited light-evoked IPSCs arising from the NAc (n = 23). Inset shows average of 10 consecutive sweeps under control conditions and in DAMGO from a representative experiment. B, The magnitude of the DAMGO-mediated inhibition onto TH(+) (n = 13) tended to be smaller than onto TH(−) (n = 10) neurons. C, The change in the coefficient of variance following application of DAMGO is correlated with the degree of inhibition. Scatter plot of the amount of inhibition versus the change in the coefficient of variance for each individual cell. Filled symbols are TH(+); open symbols are TH(−). Solid line is the linear regression through all of the data (R2 = 0.74; p < 0.001).
Figure 4.
Figure 4.
VP neurons retrogradely labeled from the VTA are hyperpolarized by mu opioids. A, Example of a DiI-filled VP neuron. Left: DiI (red); middle: biocytin fill (green); right: overlay. B, The membrane potential for VP neurons (n = 15) was hyperpolarized after bath application of the MOR-selective agonist DAMGO (1 μm). C, Scatter plot showing membrane potential change for each individual experiment.

References

    1. Austin MC, Kalivas PW. Dopaminergic involvement in locomotion elicited from the ventral pallidum/substantia innominata. Brain Res. 1991;542:123–131. doi: 10.1016/0006-8993(91)91005-L. - DOI - PubMed
    1. Balcita-Pedicino JJ, Omelchenko N, Bell R, Sesack SR. The inhibitory influence of the lateral habenula on midbrain dopamine cells: ultrastructural evidence for indirect mediation via the rostromedial mesopontine tegmental nucleus. J Comp Neurol. 2011;519:1143–1164. doi: 10.1002/cne.22561. - DOI - PMC - PubMed
    1. Bals-Kubik R, Ableitner A, Herz A, Shippenberg TS. Neuroanatomical sites mediating the motivational effects of opioids as mapped by the conditioned place preference paradigm in rats. J Pharmacol Exp Ther. 1993;264:489–495. - PubMed
    1. Bardo MT. Neuropharmacological mechanisms of drug reward: beyond dopamine in the nucleus accumbens. Crit Rev Neurobiol. 1998;12:37–67. doi: 10.1615/CritRevNeurobiol.v12.i1-2.30. - DOI - PubMed
    1. Berridge KC. ‘Liking’ and ‘wanting’ food rewards: brain substrates and roles in eating disorders. Physiol Behav. 2009;97:537–550. doi: 10.1016/j.physbeh.2009.02.044. - DOI - PMC - PubMed

Publication types

MeSH terms