Independence is elusive: set size effects on encoding precision in visual search
- PMID: 23576114
- PMCID: PMC3629901
- DOI: 10.1167/13.5.8
Independence is elusive: set size effects on encoding precision in visual search
Abstract
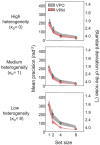
Looking for a target in a visual scene becomes more difficult as the number of stimuli increases. In a signal detection theory view, this is due to the cumulative effect of noise in the encoding of the distractors, and potentially on top of that, to an increase of the noise (i.e., a decrease of precision) per stimulus with set size, reflecting divided attention. It has long been argued that human visual search behavior can be accounted for by the first factor alone. While such an account seems to be adequate for search tasks in which all distractors have the same, known feature value (i.e., are maximally predictable), we recently found a clear effect of set size on encoding precision when distractors are drawn from a uniform distribution (i.e., when they are maximally unpredictable). Here we interpolate between these two extreme cases to examine which of both conclusions holds more generally as distractor statistics are varied. In one experiment, we vary the level of distractor heterogeneity; in another we dissociate distractor homogeneity from predictability. In all conditions in both experiments, we found a strong decrease of precision with increasing set size, suggesting that precision being independent of set size is the exception rather than the rule.
Figures


Similar articles
-
Effects of part-based similarity on visual search: the Frankenbear experiment.Vision Res. 2012 Feb 1;54:20-30. doi: 10.1016/j.visres.2011.12.004. Epub 2012 Jan 2. Vision Res. 2012. PMID: 22227607 Free PMC article.
-
Does precision decrease with set size?J Vis. 2012 Jun 8;12(6):10. doi: 10.1167/12.6.10. J Vis. 2012. PMID: 22685337 Free PMC article.
-
The roles of distractor noise and target certainty in search: a signal detection model.Vision Res. 2004 Jun;44(12):1235-56. doi: 10.1016/j.visres.2003.11.011. Vision Res. 2004. PMID: 15066389
-
Searching for two feature singletons in the visual scene: the localized attentional interference effect.Exp Brain Res. 2008 Feb;185(2):175-88. doi: 10.1007/s00221-007-1141-7. Epub 2007 Oct 6. Exp Brain Res. 2008. PMID: 17922117
-
The visual detection of threat: a cautionary tale.Psychon Bull Rev. 2013 Dec;20(6):1080-101. doi: 10.3758/s13423-013-0421-4. Psychon Bull Rev. 2013. PMID: 23504916 Review.
Cited by
-
Requiem for the max rule?Vision Res. 2015 Nov;116(Pt B):179-93. doi: 10.1016/j.visres.2014.12.019. Epub 2015 Jan 10. Vision Res. 2015. PMID: 25584425 Free PMC article.
-
A detailed comparison of optimality and simplicity in perceptual decision making.Psychol Rev. 2016 Jul;123(4):452-80. doi: 10.1037/rev0000028. Epub 2016 May 12. Psychol Rev. 2016. PMID: 27177259 Free PMC article.
-
Imperfect Bayesian inference in visual perception.PLoS Comput Biol. 2019 Apr 18;15(4):e1006465. doi: 10.1371/journal.pcbi.1006465. eCollection 2019 Apr. PLoS Comput Biol. 2019. PMID: 30998675 Free PMC article.
-
Visual Decisions in the Presence of Measurement and Stimulus Correlations.Neural Comput. 2015 Nov;27(11):2318-53. doi: 10.1162/NECO_a_00778. Epub 2015 Sep 17. Neural Comput. 2015. PMID: 26378875 Free PMC article.
-
Explaining the effects of distractor statistics in visual search.J Vis. 2020 Dec 2;20(13):11. doi: 10.1167/jov.20.13.11. J Vis. 2020. PMID: 33331851 Free PMC article.
References
-
- Baldassi S., Burr D. C. (2000). Feature-based integration of orientation signals in visual search. Vision Research, 40, 1293–1300 - PubMed
-
- Bauer B., Jolicoeur P., Cowan W. B. (1996). Visual search for colour targets that are or are not linearly separable from distractors. Vision Research, 36 (101), 1439–1465 - PubMed
-
- Broadbent D. E. (1958). Perception and communication. London: Pergamon;
-
- Busey T., Palmer J. (2008). Set-size effects for identification versus localization depend on the visual search task. Journal of Experimental Psychology: Human Perception & Performance, 34 (4), 790–810 - PubMed
Publication types
MeSH terms
Grants and funding
LinkOut - more resources
Full Text Sources
Other Literature Sources

