. 2013 May 17;288(20):14189-14199.
doi: 10.1074/jbc.M113.458414. Epub 2013 Apr 10.

Soluble epoxide hydrolase deficiency or inhibition attenuates diet-induced endoplasmic reticulum stress in liver and adipose tissue

Affiliations

Soluble epoxide hydrolase deficiency or inhibition attenuates diet-induced endoplasmic reticulum stress in liver and adipose tissue

Ahmed Bettaieb et al. J Biol Chem. .

Abstract

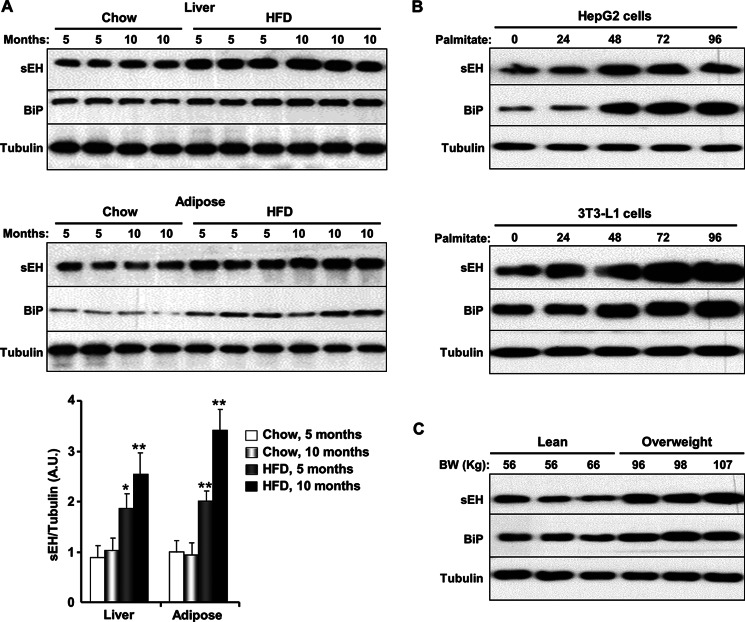
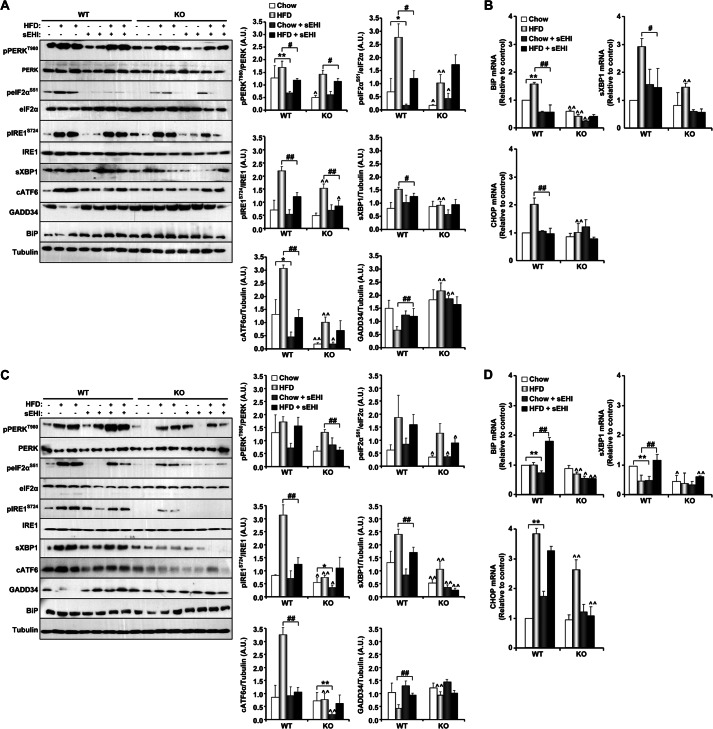
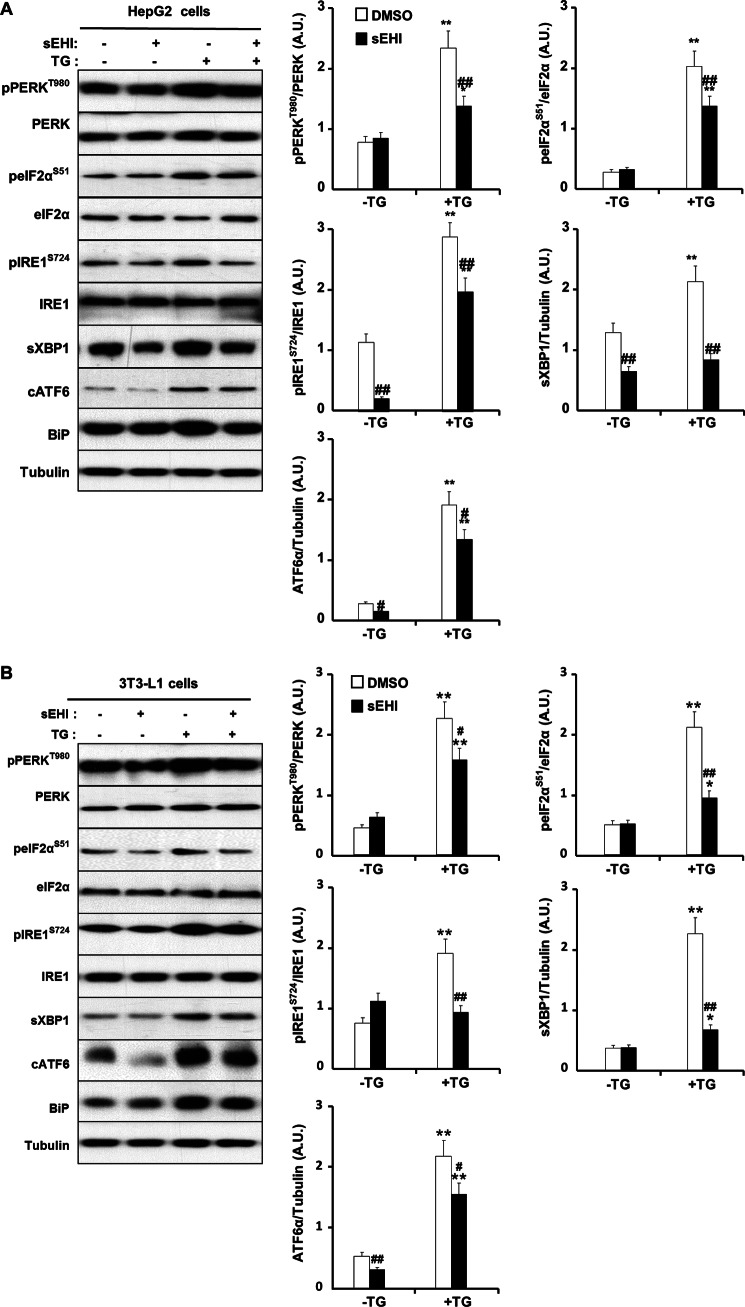
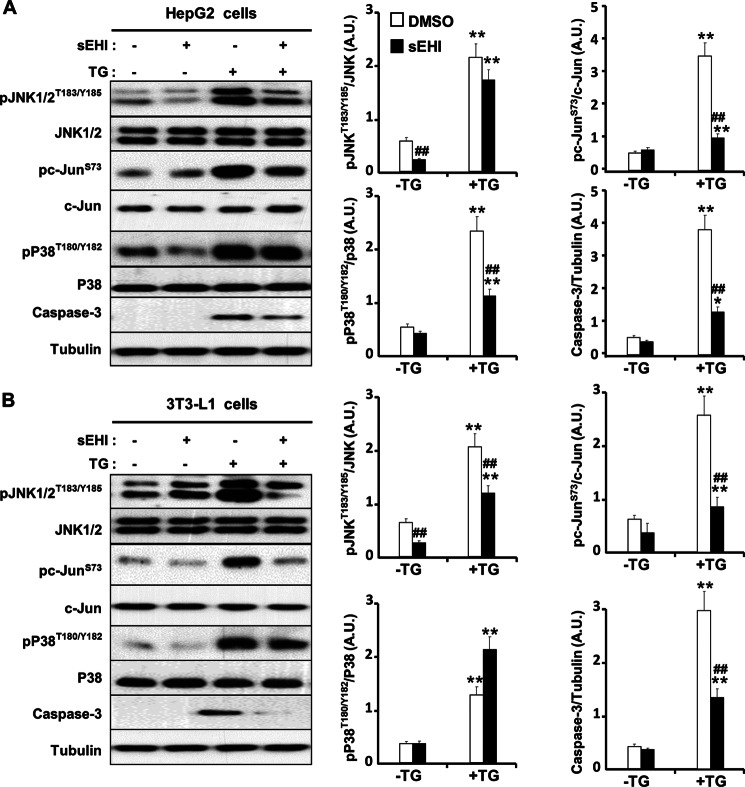
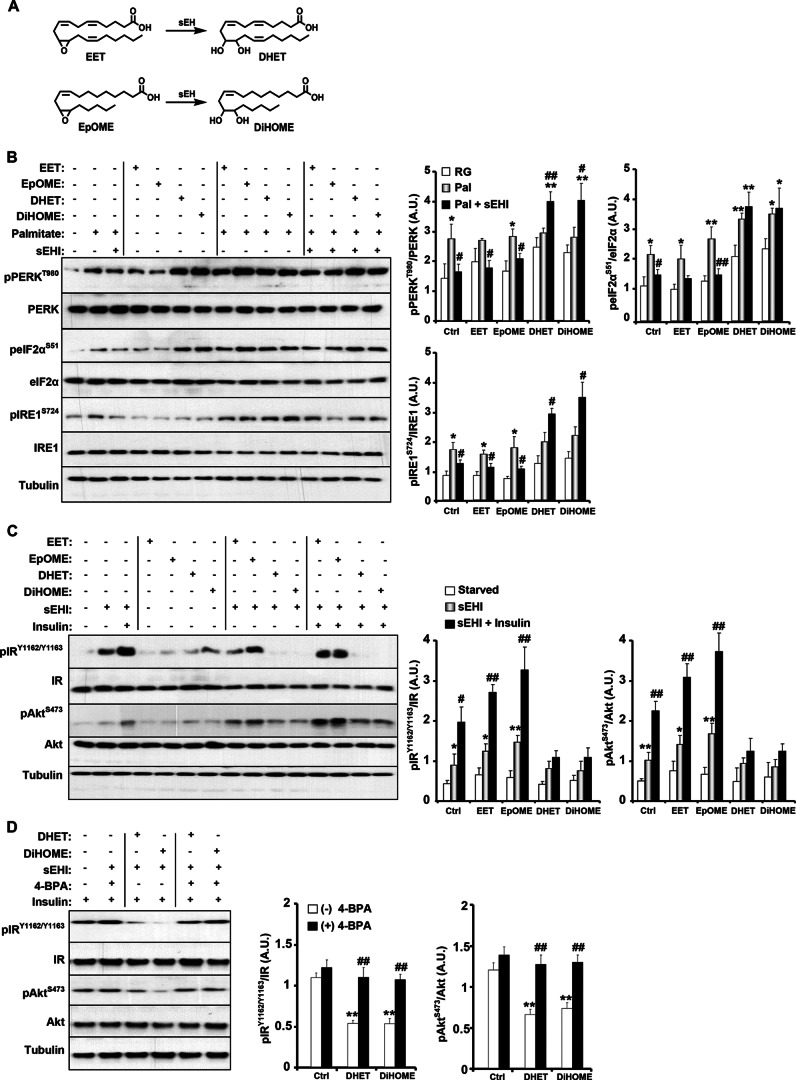
Soluble epoxide hydrolase (sEH) is a cytosolic enzyme whose inhibition has beneficial effects in cardiovascular, inflammatory, and metabolic diseases in murine models. Mice with targeted deletion or pharmacological inhibition of sEH exhibit improved insulin signaling in liver and adipose tissue. Herein, we assessed the role of sEH in regulating endoplasmic reticulum (ER) stress in liver and adipose tissue. We report that sEH expression was increased in the livers and adipose tissue of mice fed a high fat diet, the adipose tissue of overweight humans, and palmitate-treated cells. Importantly, sEH deficiency or inhibition in mice attenuated chronic high fat diet-induced ER stress in liver and adipose tissue. Similarly, pharmacological inhibition of sEH in HepG2 cells and 3T3-L1 adipocytes mitigated chemical-induced ER stress and activation of JNK, p38, and cell death. In addition, insulin signaling was enhanced in HepG2 cells treated with sEH substrates and attenuated in cells treated with sEH products. In summary, these findings demonstrate that sEH is a physiological modulator of ER stress and a potential target for mitigating complications associated with obesity.

Keywords: Endoplasmic Reticulum Stress; Epoxyeicosatrienoic Acids (EETs); Hydrolases; Inflammation; Insulin Resistance; Metabolic Regulation; Soluble Epoxide Hydrolase.


Figures

FIGURE 1.
FIGURE 1.
HFD- and chemical-induced ER stress increases sEH protein expression. A, liver (upper panel) and subcutaneous adipose tissue (lower panel) were isolated from male mice fed a regular chow diet or a HFD (60% kcal from fat) for 5 and 10 months, and lysates were immunoblotted for sEH, BiP, and tubulin. Each lane represents a sample from a separate animal. The bar graph represents normalized data expressed as arbitrary units (A.U.) for sEH/tubulin from six mice per group and presented as means ± S.E. *, p ≤ 0.05, significant difference between mice fed a HFD and those fed a regular chow diet for the corresponding duration; **, p ≤ 0.01. B, HepG2 cells (upper panel) and differentiated 3T3-L1 adipocytes (lower panel) were treated with palmitate for the indicated times, and lysates were immunoblotted for sEH, BiP, and tubulin. C, adipose tissue lysates from lean and overweight human male subjects were immunoblotted for sEH, BiP, and tubulin. BW, body weight.
FIGURE 2.
FIGURE 2.
sEH deficiency and pharmacological inhibition mitigate HFD-induced ER stress in vivo. sEH KO and WT mice were fed a regular chow diet or a HFD for 10 months as described under “Experimental Procedures.” In addition, KO and WT mice were treated with a sEHI (TUPS) or vehicle control (PEG 400) in drinking water for 10 months. Lysates from liver (A) and subcutaneous adipose tissue (C) were immunoblotted for phospho-PERK (Thr980), PERK, phospho-eIF2α (Ser51), eIF2α, phospho-IRE1α (Ser724), IRE1α, sXBP1, cATF6α, GADD34, BiP, and tubulin. Each lane represents a sample from a separate animal. The bar graphs represent normalized data expressed as arbitrary units (A.U.) for phospho-PERK/PERK, phospho-eIF2α/eIF2α, phospho-IRE1α/IRE1α, sXBP1/tubulin, ATF6α/tubulin, and GADD34/tubulin from three independent experiments and presented as means ± S.E. BiP, CHOP, and sXBP1 mRNAs from liver (B) and subcutaneous adipose tissue (D) were measured by quantitative real-time PCR and normalized against TATA box-binding protein. Data represent means ± S.E. of six mice. *, p ≤ 0.05, significant difference between sEHI-treated and non-treated mice fed a regular chow diet; **, p ≤ 0.01; #, significant difference between sEHI-treated and non-treated mice fed a HFD diet; ∧, significant difference between KO and WT mice fed the same diet.
FIGURE 3.
FIGURE 3.
sEH pharmacological inhibition mitigates chemical-induced ER stress in vitro. HepG2 cells (A) and differentiated 3T3-L1 adipocytes (B) were pretreated with a sEHI (TUPS) or vehicle control (dimethyl sulfoxide (DMSO)) for 1 h. ER stress was induced by treating cells with TG (2 μm) for 2 h. Lysates were immunoblotted for phospho-PERK (Thr980), PERK, phospho-eIF2α (Ser51), eIF2α, phospho-IRE1α (Ser724), IRE1α, sXBP1, cATF6α, BiP, and tubulin. The bar graphs represent normalized data expressed as arbitrary units (A.U.) for phospho-PERK/PERK, phospho-eIF2α/eIF2α, phospho-IRE1α/IRE1α, sXBP1/tubulin, and ATF6α/tubulin from three independent experiments and presented as means ± S.E. *, p ≤ 0.05, significant difference between TG-treated and non-treated cells; **, p ≤ 0.01; #, significant difference between sEHI-treated and non-treated cells; ##, p ≤ 0.01.
FIGURE 4.
FIGURE 4.
Modulation of ER stress-induced apoptosis signaling by sEH inhibition in vitro. HepG2 cells (A) and differentiated 3T3-L1 adipocytes (B) were pretreated with a sEHI (TUPS) or vehicle control (dimethyl sulfoxide (DMSO)) for 1 h. ER stress was induced by treating cells with TG (2 μm). Lysates were immunoblotted for phospho-JNK (Thr183/Tyr185), JNK, caspase-3, phospho-c-Jun (Ser73), c-Jun, phospho-p38 (Thr180/Tyr182), p38, and tubulin. The bar graphs represent normalized data expressed as arbitrary units (A.U.) for phospho-JNK/JNK, phospho-c-Jun/Jun, phospho-p38/p38, and caspase-3/tubulin from three independent experiments. *, p ≤ 0.05, significant difference between TG-treated and non-treated cells; **, p ≤ 0.01; ##, significant difference between sEHI-treated and non-treated cells.
FIGURE 5.
FIGURE 5.
Epoxy fatty acid treatment enhances and diol treatment attenuates insulin signaling in vitro. A, chemical structure of sEH substrates (EET and EpOME) and their conversion to the corresponding diols (DHET and DiHOME) by sEH. B, HepG2 cells were pretreated with a sEHI (TUPS) alone or in combination with EET, EpOME, DHET, or DiHOME (1 μm each) for 1 h, and then ER stress was induced by treating cells with palmitate (0.5 mm) for 24 h. Lysates were immunoblotted for phospho-PERK (Thr980), PERK, phospho-eIF2α (Ser51), eIF2α, phospho-IRE1α (Ser724), IRE1α, and tubulin. The bar graphs represent normalized data expressed as arbitrary units (A.U.) for phospho-PERK/PERK, phospho-eIF2α/eIF2α, and phospho-IRE1α/IRE1α from six independent experiments and presented as means ± S.E. *, p ≤ 0.05, significant difference between palmitate-treated and non-treated randomly growing (RG) cells; **, p ≤ 0.01; #, significant difference between palmitate (Pal)-treated and palmitate/sEHI (Pal + sEHI)-treated cells. Ctrl, control. C, HepG2 cells were starved overnight in medium containing sEHI in combination with EET, EpOME, DHET, or DiHOME and then stimulated with insulin for 10 min. Lysates were immunoblotted for phospho-IR (Tyr1162/Tyr1163), IR, phospho-AKT (Ser473), and AKT. The bar graphs represent normalized data expressed as arbitrary units for phospho-IR/IR and phospho-AKT/AKT from six independent experiments and presented as means ± S.E. *, p ≤ 0.05, significant difference between sEHI-treated and non-treated (starved) cells; #, significant difference between sEHI-treated and sEHI/insulin-treated cells. D, HepG2 cells were starved overnight in medium containing sEHI in combination with DHET or DiHOME and then stimulated with insulin for 10 min. Where indicated, 4-phenylbutyric acid (4-BPA; 20 mm) was added. Lysates were immunoblotted for phospho-IR (Tyr1162/Tyr1163), IR, phospho-AKT (Ser473), and AKT. The bar graphs represent normalized data expressed as arbitrary units for phospho-IR/IR, and phospho-AKT/AKT from five independent experiments and presented as means ± S.E. *, p ≤ 0.05, significant difference between control and DHET/DiHOME-treated cells without 4-phenylbutyric acid; #, significant difference between 4-phenylbutyric acid-treated and non-treated cells.

Similar articles

Cited by

References

    1. Friedman J. M. (2000) Obesity in the new millennium. Nature 404, 632–634 - PubMed
    1. Spiegelman B. M., Flier J. S. (2001) Obesity and the regulation of energy balance. Cell 104, 531–543 - PubMed
    1. Mensah G. A., Mokdad A. H., Ford E., Narayan K. M., Giles W. H., Vinicor F., Deedwania P. C. (2004) Obesity, metabolic syndrome, and type 2 diabetes: emerging epidemics and their cardiovascular implications. Cardiol. Clin. 22, 485–504 - PubMed
    1. Ozcan U., Cao Q., Yilmaz E., Lee A. H., Iwakoshi N. N., Ozdelen E., Tuncman G., Görgün C., Glimcher L. H., Hotamisligil G. S. (2004) Endoplasmic reticulum stress links obesity, insulin action, and type 2 diabetes. Science 306, 457–461 - PubMed
    1. Hummasti S., Hotamisligil G. S. (2010) Endoplasmic reticulum stress and inflammation in obesity and diabetes. Circ. Res. 107, 579–591 - PubMed

Publication types

MeSH terms