. 2013 Jun;87(12):6876-87.
doi: 10.1128/JVI.00421-13. Epub 2013 Apr 10.

A herpes simplex virus scaffold peptide that binds the portal vertex inhibits early steps in viral replication

Affiliations

A herpes simplex virus scaffold peptide that binds the portal vertex inhibits early steps in viral replication

Kui Yang et al. J Virol. 2013 Jun.

Abstract

Previous experiments identified a 12-amino-acid (aa) peptide that was sufficient to interact with the herpes simplex virus 1 (HSV-1) portal protein and was necessary to incorporate the portal into capsids. In the present study, cells were treated at various times postinfection with peptides consisting of a portion of the Drosophila antennapedia protein, previously shown to enter cells efficiently, fused to either wild-type HSV-1 scaffold peptide (YPYYPGEARGAP) or a control peptide that contained changes at positions 4 and 5. These 4-tyrosine and 5-proline residues are highly conserved in herpesvirus scaffold proteins and were previously shown to be critical for the portal interaction. Treatment early in infection with subtoxic levels of wild-type peptide reduced viral infectivity by over 1,000-fold, while the mutant peptide had little effect on viral yields. In cells infected for 3 h in the presence of wild-type peptide, capsids were observed to transit to the nuclear rim normally, as viewed by fluorescence microscopy. However, observation by electron microscopy in thin sections revealed an aberrant and significant increase of DNA-containing capsids compared to infected cells treated with the mutant peptide. Early treatment with peptide also prevented formation of viral DNA replication compartments. These data suggest that the antiviral peptide stabilizes capsids early in infection, causing retention of DNA within them, and that this activity correlates with peptide binding to the portal protein. The data are consistent with the hypothesis that the portal vertex is the conduit through which DNA is ejected to initiate infection.


Figures
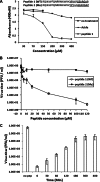
Fig 1
Fig 1
Antiviral activities of peptides. (A) Cytotoxic effects of peptides. CV1 cells in 12-well plates were treated with various concentrations of peptide overnight. The next day, cell proliferation reagent (Promega) was added to each well, and 2 h later, the absorbance at 490 nm was recorded. (B) Specific antiviral activities of peptides. Subconfluent CV1 cells in 6-well plates were infected with HSV-1(F) at an MOI of 0.1 PFU per cell. After a 1-h adsorption at 4°C and 60 min of incubation at 37°C, the inocula were removed, residual extracellular infectivity associated with the cells was reduced by treatment with a low-pH citrate buffer, and growth media containing the indicated concentrations of peptide were added. Twenty-four hours after virus infection, the amount of infectious virus was determined by plaque assay in CV1 cells. (C) Time dependence of inhibition of HSV replication. CV1 cells in 6-well plates were infected with HSV-1(F) at an MOI of 0.1 PFU per cell, allowed to adsorb for 1 h at 4°C, shifted to 37°C to allow viral entry, and then washed with citrate buffer (pH 3.0) to inactivate extracellular infectivity. For the 0-min time point, peptide was present at the time of adsorption and infection and thereafter. Otherwise, 100 μm of peptide 1 (wild type) was added at the indicated times after the citrate wash and was maintained in the medium until 24 h postinfection. The cells were then lysed by repeated freezing/thawing, and yields of infectivity were determined by plaque assay in CV1 cells. Each point and error bar for all three panels represents the mean ± standard deviation of results from three individual experiments. *, no treatment samples were done in parallel with the 30 μM, 70 μM, and 150 μM concentrations of azide or peptide.
Fig 2
Fig 2
Wild-type peptide binds to portal-containing capsids in vitro. Portal-containing B capsids (A) purified from HSV-1(F)-infected cells or portal-null B capsids (B) purified from UL6-null infected cells were loaded on carbon-coated grids and incubated with biotin-labeled peptide, and the grids were reacted with 8 to 10 nm colloidal gold beads conjugated to streptavidin. The grids were washed extensively and examined in a transmission electron microscope. (C) Percentage of labeled capsids compared to total capsids counted. GraphPad software was used for statistical analyses using Fisher's exact test. (*, P < 0.01).
Fig 3
Fig 3
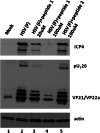
Wild-type peptide inhibits expression of ICP4 of HSV-1. CV1 cells in 6-well plates were infected with HSV-1(F) at an MOI of 10 PFU per cells as described in the legend to Fig. 1B, and the indicated concentrations of peptide 1 or peptide 2 were added to the overlying medium. Six hours or 24 h after infection, total cell lysates were prepared, separated on a denaturing SDS polyacrylamide gel, transferred to nitrocellulose, and reacted with antibodies to ICP4 (6 h postinfection) or ICP35 (24 h postinfection). The blot was stripped and reprobed with anti-actin antibodies as a loading control.
Fig 4
Fig 4
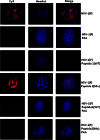
Reduction of viral DNA replication detected by fluorescence in situ hybridization. CV1 cells were grown on glass coverslips (18 mm by 18 mm) and then infected with HSV-1(F) at an MOI of 20 PFU per cell as described in the legend to Fig. 1B. The cells were untreated or treated with wild-type (WT) or mutant (Mu) scaffold peptide in the presence or absence of phosphonoacetic acid (PAA), a potent viral DNA replication inhibitor. Two and a half hours after onset of the treatments, cells were washed with PBS and then fixed by incubation for 5 min at −20°C with precooled 95% ethanol-5% glacial acetic acid. A Cy3-dCTP-labeled probe containing the BamHI P fragment of the HSV-1 genome was reacted for hybridization, as described in Materials and Methods. After hybridization and washing, the coverslips were counterstained with Hoechst stain, mounted on glass slides, and examined by confocal microscopy. The images were captured and exported as TIFF files and processed with Adobe Photoshop software. The red signal indicates the presence of viral DNA. Globular domains within the nucleus identify the viral DNA replication compartment.
Fig 5
Fig 5
Incoming capsids accumulate near the nuclear rim in the presence of peptide. Confluent CV1 cells on glass coverslips (18 mm by 18 mm) were infected with K26 GFP virus at an MOI of 20 PFU per cell as described in the legend to Fig. 1B, and 100 μm of peptide 1 or 2 was added when the medium was shifted to 37°C. Three hours postinfection, the cells were washed with PBS, fixed with 3% paraformaldehyde, stained with Hoechst to locate cellular nuclei, and viewed by confocal microscopy. Top, example image showing capsids (green dots) on the nuclear rim of cells in the right panel (arrows); bottom, graph shows the number of dots associated with the nuclear rim. The number is an average number of capsids per nucleus from 50 cells viewed for each sample.
Fig 6
Fig 6
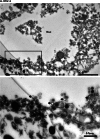
Examination of virus-infected cells in the presence of peptide by electron microscopy. Subconfluent CV1 cells in 6-well plates were infected with HSV-1(F) at an MOI of 20 PFU per cell in the presence or absence of 100 μM wild-type or mutant peptide. Three hours after infection, the cells were fixed and embedded, and thin sections were examined by transmission electron microscopy. Magnifications in the upper panels were ×11,000 for panel A and ×13,000 for panels B and C. Magnification for the selected area (boxed and shown in lower panels) was ×30,000. The images were taken and processed with Adobe Photoshop software. (A) Electron micrograph of untreated HSV-1(F)-infected cells; (B) electron micrograph of cells infected with HSV-1(F) in the presence of wild-type peptide (peptide 1); (C) electron micrograph of cells infected with mutant peptide (peptide 2). Ten sections were examined for each treatment, and the number of DNA-containing capsids (C capsids; open arrowheads) and empty capsids (A capsids; solid arrows) were counted. Approximately 1,000 capsids were counted for each treatment. (D) A histogram of the percentage of A or C capsids relative to total capsids counted is shown. Statistical analyses were performed using Fisher's exact test. *, P < 0.01. A size standard is shown at the lower right of panel A and at the lower left of panels B and C.
Fig 6
Fig 6
Examination of virus-infected cells in the presence of peptide by electron microscopy. Subconfluent CV1 cells in 6-well plates were infected with HSV-1(F) at an MOI of 20 PFU per cell in the presence or absence of 100 μM wild-type or mutant peptide. Three hours after infection, the cells were fixed and embedded, and thin sections were examined by transmission electron microscopy. Magnifications in the upper panels were ×11,000 for panel A and ×13,000 for panels B and C. Magnification for the selected area (boxed and shown in lower panels) was ×30,000. The images were taken and processed with Adobe Photoshop software. (A) Electron micrograph of untreated HSV-1(F)-infected cells; (B) electron micrograph of cells infected with HSV-1(F) in the presence of wild-type peptide (peptide 1); (C) electron micrograph of cells infected with mutant peptide (peptide 2). Ten sections were examined for each treatment, and the number of DNA-containing capsids (C capsids; open arrowheads) and empty capsids (A capsids; solid arrows) were counted. Approximately 1,000 capsids were counted for each treatment. (D) A histogram of the percentage of A or C capsids relative to total capsids counted is shown. Statistical analyses were performed using Fisher's exact test. *, P < 0.01. A size standard is shown at the lower right of panel A and at the lower left of panels B and C.

Similar articles

Cited by

References

    1. Furman PA, de MP, St Clair MH, Elion GB. 1981. Metabolism of acyclovir in virus-infected and uninfected cells. Antimicrob. Agents Chemother. 20:518–524 - PMC - PubMed
    1. Elion GB. 1982. Mechanism of action and selectivity of acyclovir. Am. J. Med. 73:7–13 - PubMed
    1. Piret J, Boivin G. 2011. Resistance of herpes simplex viruses to nucleoside analogues: mechanisms, prevalence, and management. Antimicrob. Agents Chemother. 55:459–472 - PMC - PubMed
    1. Thompson C, Whitley R. 2011. Neonatal herpes simplex virus infections: where are we now? Hot topics in infective immunity in children VII, p 221–230 In Curtis N, Finn A, Pollard AJ. (ed), 697 ed. Springer, New York, NY - PMC - PubMed
    1. Price NB, Prichard MN. 2011. Progress in the development of new therapies for herpesvirus infections. Curr. Opin. Virol. 1:548–554 - PMC - PubMed

Publication types

MeSH terms

LinkOut - more resources