. 2013 Apr 16;110(16):E1524-32.
doi: 10.1073/pnas.1220179110. Epub 2013 Apr 1.

Neural progenitors organize in small-world networks to promote cell proliferation

Affiliations

Neural progenitors organize in small-world networks to promote cell proliferation

Seth Malmersjö et al. Proc Natl Acad Sci U S A. .

Abstract

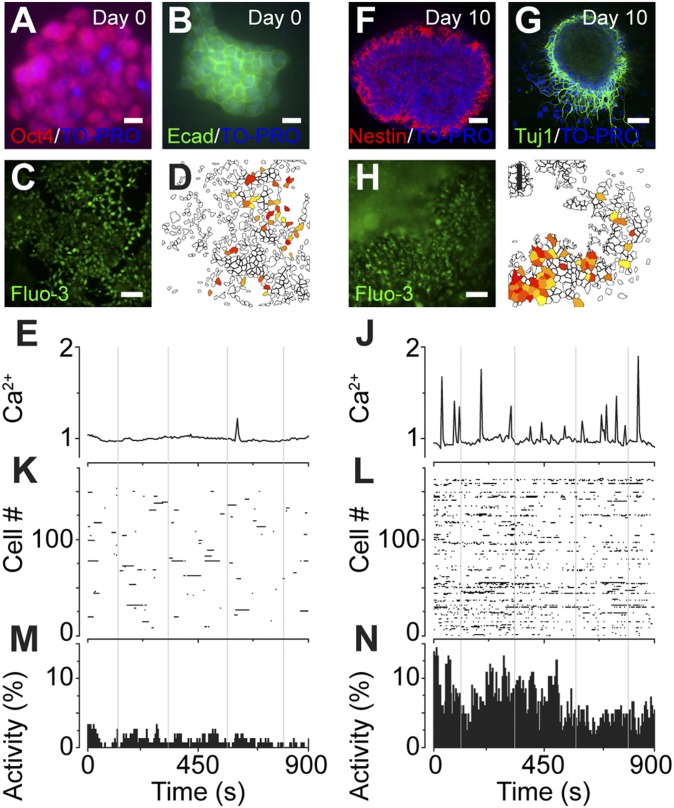
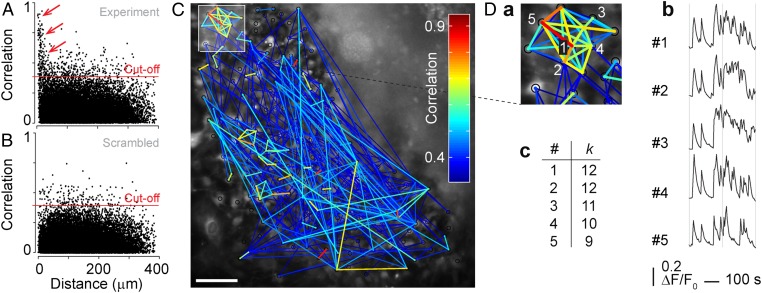
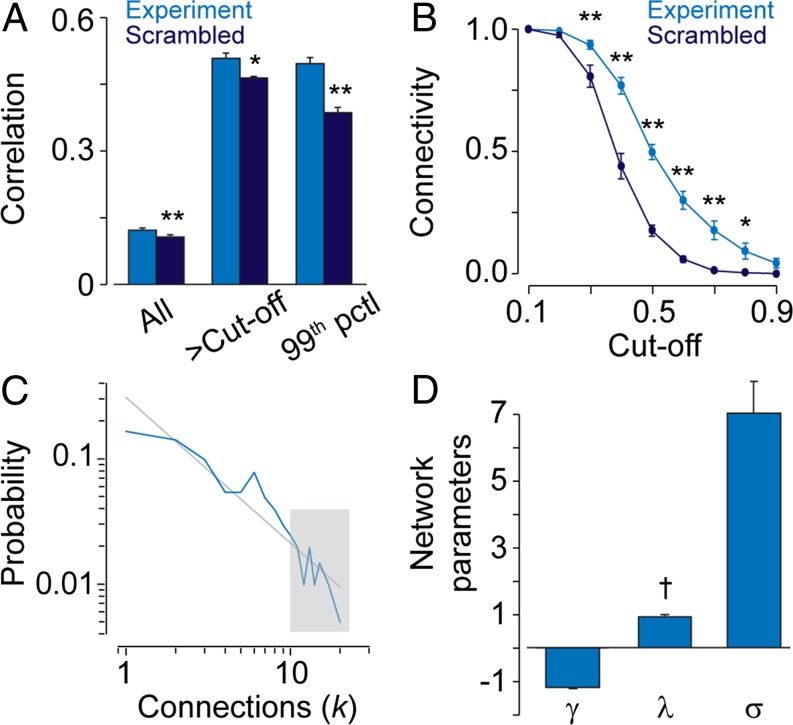
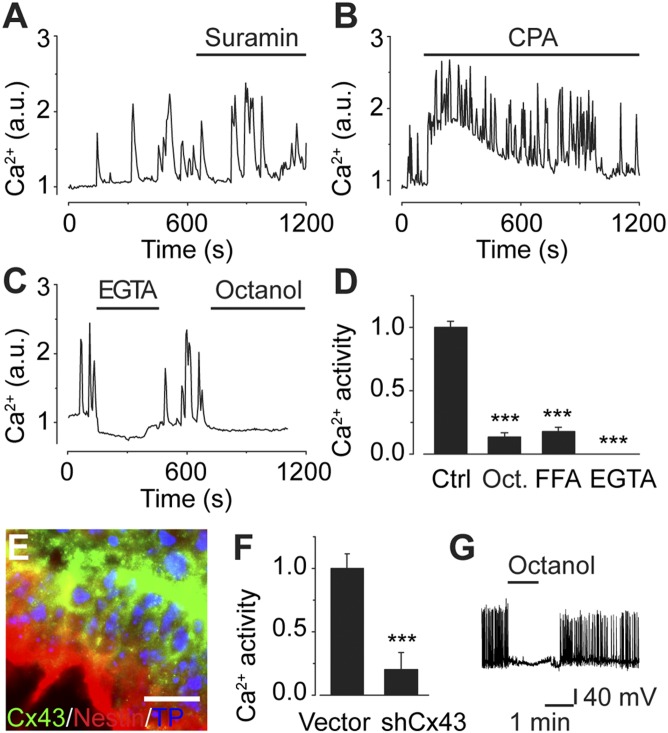
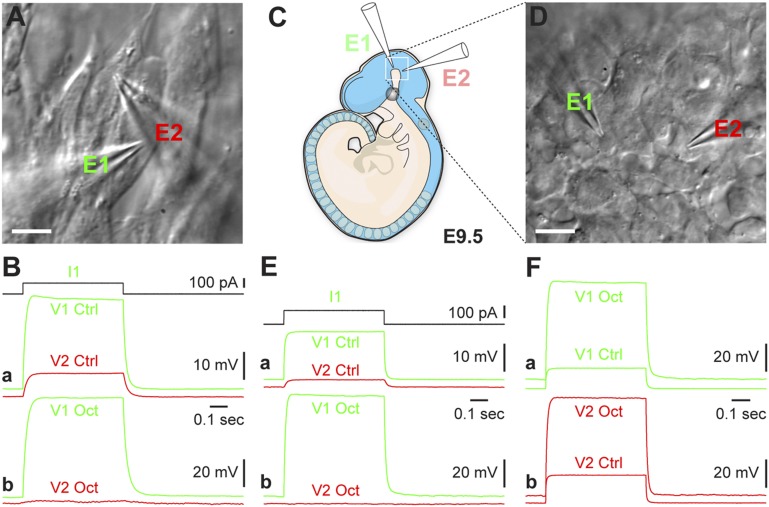
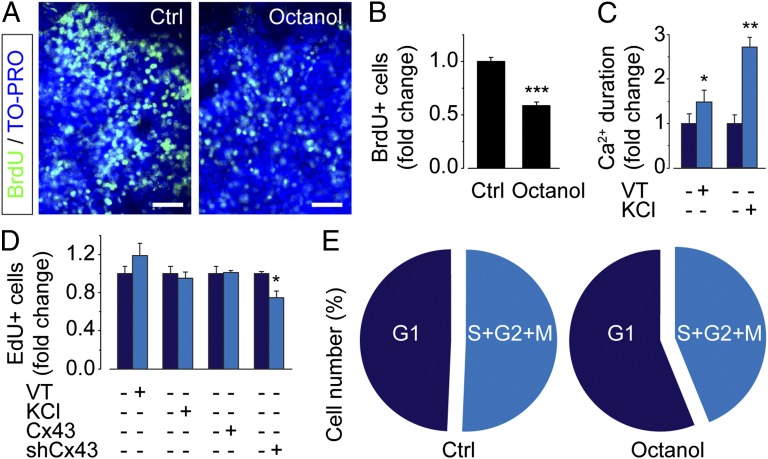
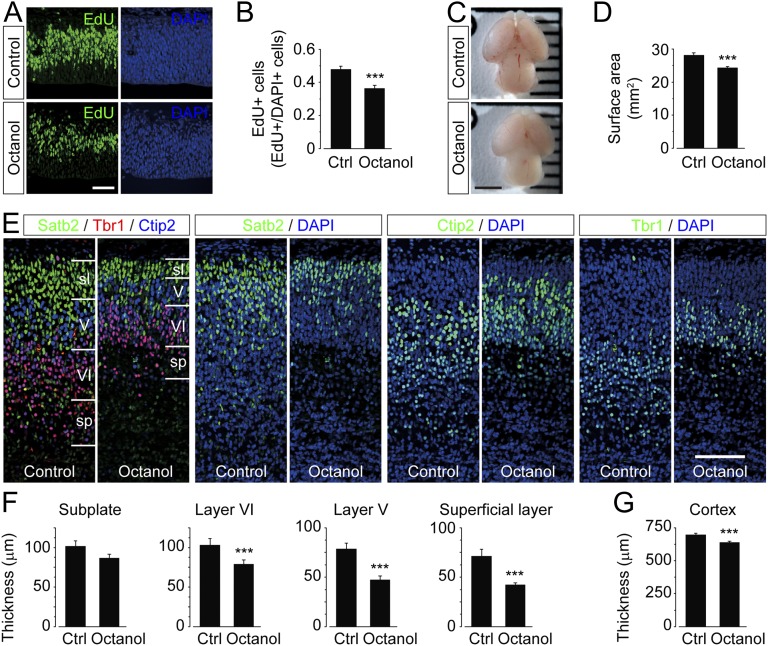
Coherent network activity among assemblies of interconnected cells is essential for diverse functions in the adult brain. However, cellular networks before formations of chemical synapses are poorly understood. Here, embryonic stem cell-derived neural progenitors were found to form networks exhibiting synchronous calcium ion (Ca(2+)) activity that stimulated cell proliferation. Immature neural cells established circuits that propagated electrical signals between neighboring cells, thereby activating voltage-gated Ca(2+) channels that triggered Ca(2+) oscillations. These network circuits were dependent on gap junctions, because blocking prevented electrotonic transmission both in vitro and in vivo. Inhibiting connexin 43 gap junctions abolished network activity, suppressed proliferation, and affected embryonic cortical layer formation. Cross-correlation analysis revealed highly correlated Ca(2+) activities in small-world networks that followed a scale-free topology. Graph theory predicts that such network designs are effective for biological systems. Taken together, these results demonstrate that immature cells in the developing brain organize in small-world networks that critically regulate neural progenitor proliferation.


Conflict of interest statement

The authors declare no conflict of interest.

Figures

Fig. 1.
Fig. 1.
Neural progenitors derived from ES cells exhibit spontaneous Ca2+ activity. (A and B) Pluripotency markers Oct4 (A) and Ecad (B) were expressed in mouse ES cells on day 0. Nuclei were counterstained with TO-PRO-3. (Scale bars, 10 µm.) (C–E) ES cells on day 0 loaded with Fluo-3/AM (C) exhibited rare events of spontaneous Ca2+ activity. (D) Snapshot at 1 min of experiment. (Scale bar, 50 µm.) (E) Representative single cell Ca2+ trajectory. (F and G) Neural progenitor marker nestin (F) and TuJ1 (G) were expressed in mouse ES cells differentiated for 10 d. Nuclei were counterstained with TO-PRO-3. (Scale bars, 50 µm.) (H–J) Neural progenitor cells loaded with Fluo-3/AM (H) exhibited vivid clustered spontaneous Ca2+ activity. (I) Snapshot at 31 min of experiment. (Scale bar, 50 µm.) (J) Representative single cell Ca2+ trajectory. (K and L) Raster plots of ES cells (K) and neural progenitor cells (L) where each row represents a single-cell Ca2+ recording with peak activities marked with black dots. (M and N) Activity histograms of ES cells in K and neural progenitor cells in L depicting the percentage of active cells at each time point. See also Fig. S1.
Fig. 2.
Fig. 2.
Neural progenitor cells form functional Ca2+ signaling networks. (A and B) Correlation coefficients as a function of intercellular distance for experimental Ca2+ recordings (A) and scrambled data (B). Red lines indicate cutoff (0.39) equal to the mean value of the 99th percentile for scrambled data. Arrows indicate cells with high correlation and short intercellular distances. (C) Network plot of cross-correlation coefficients larger than cutoff (color coded as indicated) derived from Ca2+ recordings of neural progenitor cells. (Scale bar, 50 µm.) Cluster of cells (D, a), outlined in C, with strong intercellular correlation together with five single-cell Ca2+ traces (D, b). The number of connected cells is indicated with k (D, c). See also Fig. S2.
Fig. 3.
Fig. 3.
Neural progenitors organize in small-world networks that follow a scale-free topology. (A) Statistical analyses of correlation coefficients derived from experimental Ca2+ recordings and scrambled data. The entire data set (All), and filtered data sets greater than cutoff (>Cut-off) or the 99th percentile (99th pctl) are presented. (B) Connectivity as a function of cutoff values of experimental and scrambled data. (C) The probability distribution, P(k), plotted in a log-log scale with linear regression fit in gray. The gray box indicates highly connected cells (five cells shown in Fig. 2D). (D) Network parameters calculated from experimental Ca2+ recordings. Slope (γ) is a measure for scale-free networks, and path length (λ) and clustering (σ) are measures for small-world networks. Values are mean ± SEM; P > 0.95, *P < 0.05, **P < 0.01. See also Fig. S2.
Fig. 4.
Fig. 4.
Gap junctions and extracellular Ca2+ mediate spontaneous Ca2+ activity. (A and B) Neither ATP receptor inhibitor suramin (100 µM; A) nor sarco/endoplasmic reticulum Ca2+-ATPase inhibitor CPA (20 µM; B) inhibited spontaneous Ca2+ activity. (C) Eliminating extracellular Ca2+ (EGTA, 2 mM) or gap junction inhibitor octanol (1 mM) abolished Ca2+ activity. (D) Quantification of spontaneous Ca2+ activity following inhibition with octanol (Oct.), FFA (100 µM), or EGTA compared with control (Ctrl). (E) Immunocytochemistry of neural progenitor cells (day 8) stained for Cx43 and nestin. Nuclei were counterstained with TO-PRO-3 (TP). (Scale bar, 20 µm.) (F) Cx43 knock-down with shRNA (shCx43) significantly reduced the spontaneous Ca2+ activity, compared with empty vector (Vector). (G) Octanol (1 mM) blocked spontaneous electrical activity. Line under name of applied drug indicates time of drug administration. Values are mean ± SEM; ***P < 0.001. See also Fig. S3.
Fig. 5.
Fig. 5.
Neural progenitors establish gap junction-dependent electrical circuits in vitro and in vivo. (A) Two ES cell-derived neural progenitor cells simultaneously patched with electrode 1 (E1) and electrode 2 (E2). (Scale bar, 10 µm.) (B, a) Injecting a 100 pA-pulse (I1) into one cell (E1) revealed electrical coupling with a neighboring cell (E2). (B, b) Adding octanol (1 mM) to the medium blocked the electrical coupling between cells. Note the increased input resistance of the recorded cells, as evidenced by the larger voltage response in cell 1 (green traces: V1 control vs. V1 octanol). (C and D) In vivo patch clamp recordings of two separated neural progenitors in whole-mouse embryos on day E9.5 (C) using two electrodes E1 and E2 (D). (Scale bar, 10 µm.) (E, a) Injecting a 100 pA-pulse (I1) into one cell (E1) induced a voltage response in the neighboring cell (E2). (E, b) Bath application with octanol (1 mM) blocked transmission between cells. (F) Bath application of octanol (1 mM) increased the input resistance of recorded cells due to the blockade of gap junctions, as seen by the increased voltage response to a 100-pA current step in each of the cells. See also Fig. S4.
Fig. 6.
Fig. 6.
Inhibiting gap junction-dependent network circuits diminishes neural progenitor proliferation. (A) Immunocytochemical staining with BrdU and TO-PRO-3 of neural progenitor cells treated with control (Ctrl) or octanol (1 mM) for 7 h. (Scale bars, 50 µm.) (B) Quantification of BrdU-positive neural progenitors treated with octanol (1 mM) normalized to control. (C) Ca2+ duration in neural progenitors treated with veratridine (VT; 20 μM) or KCl (25 mM). (D) Quantification of EdU-positive neural progenitors treated with VT (20 μM) or KCl (25 mM) or transfected with Cx43-mCherry (Cx43) or shRNA/Cx43 (shCx43). (E) Flow cytometry measurements of cell cycle distribution using PI staining of control (Ctrl)- or octanol (1 mM)-treated neural progenitor cells. Values are mean ± SEM; *P < 0.05, **P < 0.01, ***P < 0.001. See also Fig. S5.
Fig. 7.
Fig. 7.
Inhibiting gap junction-dependent network circuits affects proliferation and cortical layer formation in the embryonic brain. (A) Immunohistochemistry images of the dorsolateral cortex in the central region of the brain hemisphere stained with EdU (green) following i.p. injection of control or octanol (0.5 mg/g body weight) at E12.5. Nuclei were counterstained with DAPI (blue). (Scale bar, 100 µm.) (B) Quantification of EdU-positive cells, measured as number of EdU- vs. DAPI-positive cells in sections from control (Ctrl)- or octanol-treated animals. (C and D) Images of brains (C) and calculations of brain surface area (D) from E17.5 animals treated with control or octanol (0.5 mg/g body weight) at E12.5. (Scale bar, 2 mm.) (E) Immunohistochemistry images of the dorsolateral cortex in the central region of the brain hemisphere at E17.5 following i.p. injection of control or octanol (0.5 mg/g body weight) at E12.5 stained for: Satb2, Tbr1, and Ctip2. Marked layers are superficial layer (sl), layer V (V), layer VI (VI), and subplate (sp). Nuclei were counterstained with DAPI (blue). (Scale bar, 100 µm.) (F and G) Thicknesses of layers: subplate, V, VI, and superficial layer (F) and overall cortical thickness (G) in E17.5 animals that were control- or octanol-injected at E12.5. Values are mean ± SEM; ***P < 0.001. See also Fig. S6.

Similar articles

Cited by

References

    1. McCulloch W, Pitts W. A logical calculus of the ideas immanent in nervous activity. Bull Math Biophys. 1943;5:115–133. - PubMed
    1. Dehaene S, Changeux JP. Experimental and theoretical approaches to conscious processing. Neuron. 2011;70(2):200–227. - PubMed
    1. Albert R, Barabasi AL. Statistical mechanics of complex networks. Rev Mod Phys. 2002;74(1):47–97.
    1. Feldt S, Bonifazi P, Cossart R. Dissecting functional connectivity of neuronal microcircuits: Experimental and theoretical insights. Trends Neurosci. 2011;34(5):225–236. - PubMed
    1. Barkai N, Leibler S. Robustness in simple biochemical networks. Nature. 1997;387(6636):913–917. - PubMed

Publication types