Transitions to catalytically inactive conformations in EGFR kinase
- PMID: 23576739
- PMCID: PMC3645566
- DOI: 10.1073/pnas.1220843110
Transitions to catalytically inactive conformations in EGFR kinase
Abstract
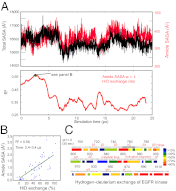
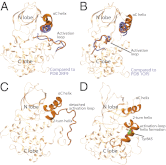
The epidermal growth factor receptor (EGFR) is a key protein in cellular signaling, and its kinase domain (EGFR kinase) is an intensely pursued target of small-molecule drugs. Although both catalytically active and inactive conformations of EGFR kinase have been resolved crystallographically, experimental characterization of the transitions between these conformations remains difficult. Using unbiased, all-atom molecular dynamics simulations, we observed EGFR kinase spontaneously transition from the active to the so-called "Src-like inactive" conformation by way of two sets of intermediate conformations: One corresponds to a previously identified locally disordered state and the other to previously undescribed "extended" conformations, marked by the opening of the ATP-binding site between the two lobes of the kinase domain. We also simulated the protonation-dependent transition of EGFR kinase to another ["Asp-Phe-Gly-out" ("DFG-out")] inactive conformation and observed similar intermediate conformations. A key element observed in the simulated transitions is local unfolding, or "cracking," which supports a prediction of energy landscape theory. We used hydrogen-deuterium (H/D) exchange measurements to corroborate our simulations and found that the simulated intermediate conformations correlate better with the H/D exchange data than existing active or inactive EGFR kinase crystal structures. The intermediate conformations revealed by our simulations of the transition process differ significantly from the existing crystal structures and may provide unique possibilities for structure-based drug discovery.
Conflict of interest statement
The authors declare no conflict of interest.
Figures


Comment in
-
Disorder guides protein function.Proc Natl Acad Sci U S A. 2013 Apr 30;110(18):7114-5. doi: 10.1073/pnas.1305236110. Epub 2013 Apr 22. Proc Natl Acad Sci U S A. 2013. PMID: 23610426 Free PMC article. No abstract available.
Similar articles
-
Structural analysis of the catalytically inactive kinase domain of the human EGF receptor 3.Proc Natl Acad Sci U S A. 2009 Dec 22;106(51):21608-13. doi: 10.1073/pnas.0912101106. Epub 2009 Dec 9. Proc Natl Acad Sci U S A. 2009. PMID: 20007378 Free PMC article.
-
A Src-like inactive conformation in the abl tyrosine kinase domain.PLoS Biol. 2006 May;4(5):e144. doi: 10.1371/journal.pbio.0040144. Epub 2006 May 2. PLoS Biol. 2006. PMID: 16640460 Free PMC article.
-
Inter-lobe Motions Allosterically Regulate the Structure and Function of EGFR Kinase.J Mol Biol. 2020 Jul 24;432(16):4561-4575. doi: 10.1016/j.jmb.2020.06.007. Epub 2020 Jun 10. J Mol Biol. 2020. PMID: 32534062
-
Catalytic control in the EGF receptor and its connection to general kinase regulatory mechanisms.Mol Cell. 2011 Apr 8;42(1):9-22. doi: 10.1016/j.molcel.2011.03.004. Mol Cell. 2011. PMID: 21474065 Free PMC article. Review.
-
Small molecule inhibitors targeting the EGFR/ErbB family of protein-tyrosine kinases in human cancers.Pharmacol Res. 2019 Jan;139:395-411. doi: 10.1016/j.phrs.2018.11.014. Epub 2018 Nov 27. Pharmacol Res. 2019. PMID: 30500458 Review.
Cited by
-
The next tier of EGFR resistance mutations in lung cancer.Oncogene. 2021 Jan;40(1):1-11. doi: 10.1038/s41388-020-01510-w. Epub 2020 Oct 15. Oncogene. 2021. PMID: 33060857 Review.
-
Protein Loop Conformational Free Energy Changes via an Alchemical Path without Reaction Coordinates.J Phys Chem Lett. 2021 May 13;12(18):4368-4377. doi: 10.1021/acs.jpclett.1c00778. Epub 2021 May 3. J Phys Chem Lett. 2021. PMID: 33938761 Free PMC article.
-
Conformational analysis of the DFG-out kinase motif and biochemical profiling of structurally validated type II inhibitors.J Med Chem. 2015 Jan 8;58(1):466-79. doi: 10.1021/jm501603h. Epub 2014 Dec 12. J Med Chem. 2015. PMID: 25478866 Free PMC article.
-
The SH2 domain regulates c-Abl kinase activation by a cyclin-like mechanism and remodulation of the hinge motion.PLoS Comput Biol. 2014 Oct 9;10(10):e1003863. doi: 10.1371/journal.pcbi.1003863. eCollection 2014 Oct. PLoS Comput Biol. 2014. PMID: 25299346 Free PMC article.
-
Dynamic Motion and Communication in the Streptococcal C1 Phage Lysin, PlyC.PLoS One. 2015 Oct 15;10(10):e0140219. doi: 10.1371/journal.pone.0140219. eCollection 2015. PLoS One. 2015. PMID: 26470022 Free PMC article.
References
-
- Yarden Y, Sliwkowski MX. Untangling the ErbB signalling network. Nat Rev Mol Cell Biol. 2001;2(2):127–137. - PubMed
-
- Lurje G, Lenz H-J. EGFR signaling and drug discovery. Oncology. 2009;77(6):400–410. - PubMed
-
- Stamos J, Sliwkowski MX, Eigenbrot C. Structure of the epidermal growth factor receptor kinase domain alone and in complex with a 4-anilinoquinazoline inhibitor. J Biol Chem. 2002;277(48):46265–46272. - PubMed
-
- Wood ER, et al. A unique structure for epidermal growth factor receptor bound to GW572016 (Lapatinib): Relationships among protein conformation, inhibitor off-rate, and receptor activity in tumor cells. Cancer Res. 2004;64(18):6652–6659. - PubMed
-
- Zhang XW, Gureasko J, Shen K, Cole PA, Kuriyan J. An allosteric mechanism for activation of the kinase domain of epidermal growth factor receptor. Cell. 2006;125(6):1137–1149. - PubMed
MeSH terms
Substances
LinkOut - more resources
Full Text Sources
Other Literature Sources
Research Materials
Miscellaneous

