. 2013 Apr 16;110(16):6488-93.
doi: 10.1073/pnas.1221312110. Epub 2013 Apr 1.

Imaging burst kinetics and spatial coordination during serial killing by single natural killer cells

Affiliations

Imaging burst kinetics and spatial coordination during serial killing by single natural killer cells

Paul J Choi et al. Proc Natl Acad Sci U S A. .

Abstract

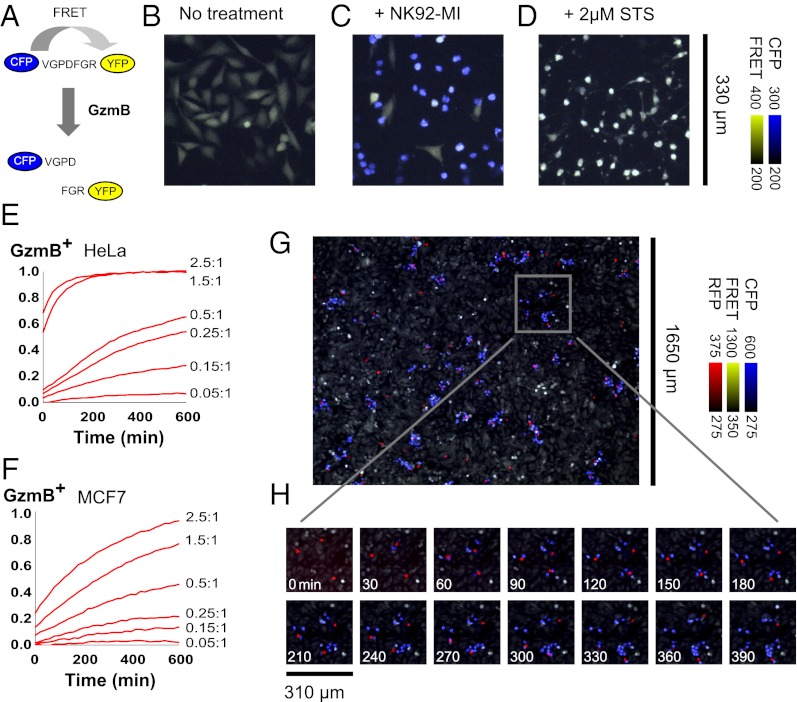
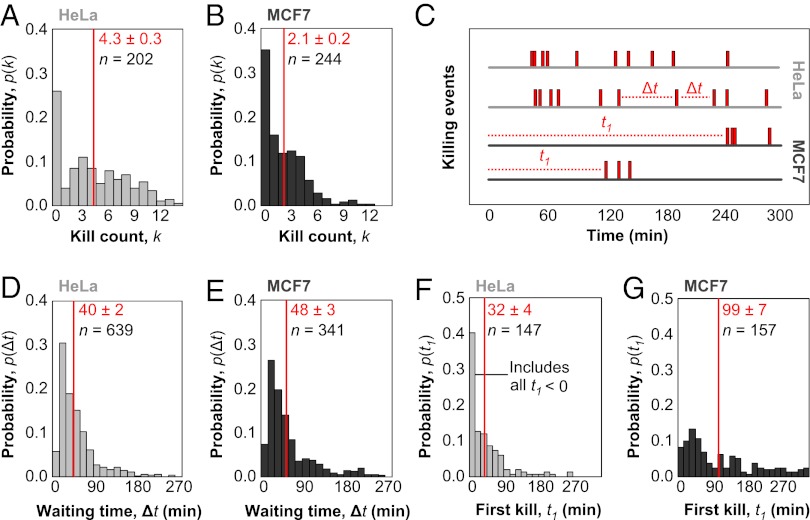
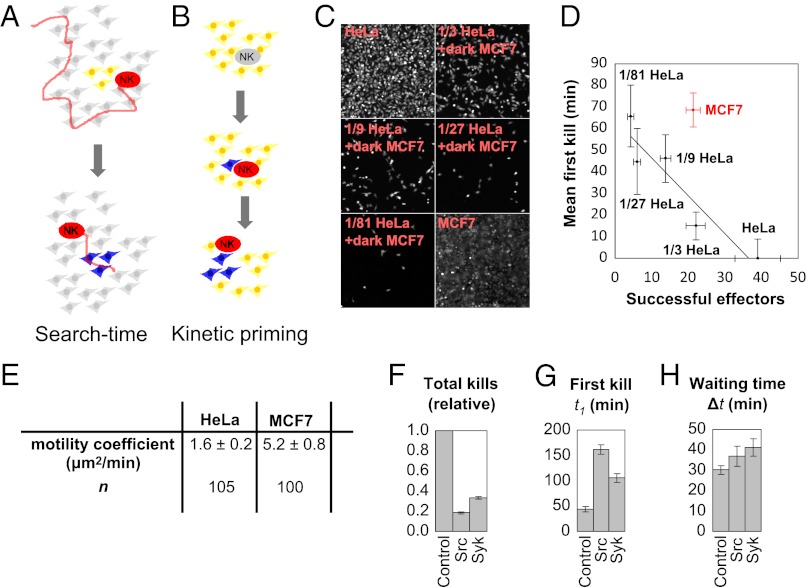
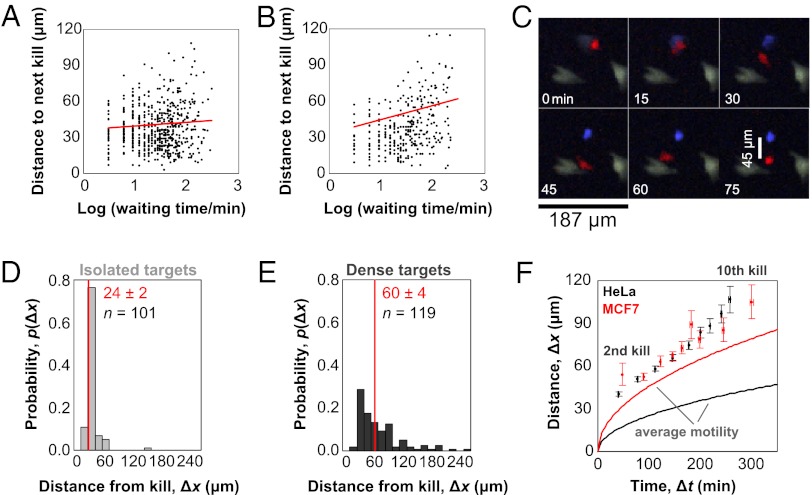
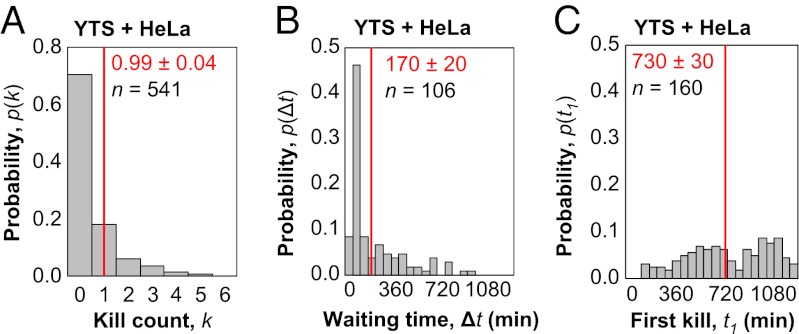
Cytotoxic lymphocytes eliminate virus-infected and cancerous cells by immune recognition and killing through the perforin-granzyme pathway. Traditional killing assays measure average target cell lysis at fixed times and high effector:target ratios. Such assays obscure kinetic details that might reveal novel physiology. We engineered target cells to report on granzyme activity, used very low effector:target ratios to observe potential serial killing, and performed low magnification time-lapse imaging to reveal time-dependent statistics of natural killer (NK) killing at the single-cell level. Most kills occurred during serial killing, and a single NK cell killed up to 10 targets over a 6-h assay. The first kill was slower than subsequent kills, especially on poor targets, or when NK signaling pathways were partially inhibited. Spatial analysis showed that sequential kills were usually adjacent. We propose that NK cells integrate signals from the previous and current target, possibly by simultaneous contact. The resulting burst kinetics and spatial coordination may control the activity of NK cells in tissues.


Conflict of interest statement

The authors declare no conflict of interest.

Figures

Fig. 1.
Fig. 1.
Live-cell granzyme B reporter enables a single-cell killing assay. (A) Förster resonance energy transfer (FRET) between fluorescent protein variants (37) can report on protease activity. We constructed a reporter for GzmB by using cyan (CFP) and yellow (YFP) fluorescent proteins fused by the peptide linker VGPDFGR. (BD) HeLa cell stably expressing the GzmB reporter are imaged after 4 h of no treatment (B), treatment with 1:1 NK92-MI cells (C), or treatment with 2 μM staurosporine (EMD Biosciences) (D). An overlay of CFP emission (blue) and FRET emission (yellow) leads to strongly blue cells after cleavage of the GzmB reporter (Fig. S1). The reporter specifically indicates GzmB and not caspase activity (Fig. S2). (E and F) HeLa (E) or MCF7 (F) targets stably expressing the GzmB reporter are incubated at the indicated E:T ratio with NK92-MI, and the fraction of GzmB-positive targets is determined at each time point by using the integrated fluorescence emission of an entire field of view in comparison with standards with zero or complete killing. (G) At an E:T ratio <0.05:1, clusters of GzmB-positive targets cells indicate killing of multiple targets by well-isolated individual effector cells. Low magnification (4×) aided in obtaining measurements from a sufficient number of individual effector cells, labeled with CellTracker Orange (Invitrogen) (red), at this low dilution. The live-cell stain and phototoxicity had minimal effect on killing activity (Fig. S3). (H) Serial killing by individual NK92-MI cells can be tracked in a time lapse.
Fig. 2.
Fig. 2.
Quantitative single-cell measurements of serial killing. (A and B) Histogram of kill count, k, for the total number of targets killed by individual effector cells for HeLa (A) and MCF7 (B) targets after 6 h of coincubation of 500 NK92-MI cells and 2 × 10⁴ HeLa or 3 × 10⁴ MCF7 cells per well of a 96-well plate. For all of the following histograms, mean values and associated SEs are indicated in red, whereas n is the sample size. For A and B, n indicates the total number of NK cells profiled. Each NK cell is assigned a value for k based on the total number of kills over 6 h. The histogram shows the probability that a single NK cell among the n observed will have a particular value of k. (C) Sample killing traces of individual effector cells are shown, with killing events marked along the time axis by red bars. The waiting time, Δt, denotes the interval between successive killing events. The first kill time, t1, denotes the time before the first killing event. (D and E) Histogram of waiting times for HeLa (D) and MCF7 (E) targets. For D and E, n denotes the total number of waiting times recorded when two killing events occur in succession. NK cells with k < 2 do not contribute waiting times, whereas NK cells with k > 2 contribute multiple waiting times. The histogram shows the probability that any individual waiting time has a particular value of Δt. (F and G) Histogram of first kill times for HeLa (F) and MCF7 (G) targets. For F and G, n denotes the total number of first kill times measured, which is equivalent to the number of NK cells with k > 0. The histogram shows the probability that any individual first kill time has a particular value of t1.
Fig. 3.
Fig. 3.
Bursting kinetics in serial killing. (A) In a search-time model, the long t1 accounts for the time to find a cluster of easily killed targets, followed by rapid subsequent kills with a short 〈Δt〉. (B) In a kinetic-priming model, the long t1 accounts for poor target recognition of the first target, followed by a change in effector state that leads to rapid subsequent kills with a short 〈Δt〉. (C) A mixture of fluorescent, well-killed HeLa targets on a background of nonfluorescent MCF7 targets mimics the scenario from the search-time model. (D) The changes in first kill time and number of successful effectors as a function of HeLa target dilution estimates the contribution of search time to the killing kinetics (see Results and Discussion). We set 〈t1〉 = 0 for 100% HeLa targets and report the relative 〈t1〉 for the other cases. (E) The average motility coefficient for effector cells on MCF7 targets is larger than on HeLa targets. (F) Killing is partially repressed at intermediate concentrations of the Src inhibitor PP2 (700 ng/mL; Sigma) and the Syk inhibitor BAY 61–3606 (500 ng/mL; Santa Cruz Biotechnology) after 6 h of incubation of 500 NK92-MI cells and 2 × 10⁴ HeLa or 3 × 10⁴ MCF7 cells per well of a 96-well plate. Samples sizes of 406, 143, and 218 total kills were measured for the control, Src-inhibitor, and Syk-inhibitor samples, respectively. (G) Average first kill times 〈t1〉 for untreated and inhibitor treated samples. Sample sizes of 104, 96, and 116 first kill times were measured for the control, Src-inhibitor, and Syk-inhibitor samples, respectively. (H) Average waiting times, 〈Δt〉, for treated and inhibitor treated samples. Sample sizes of 334, 100, and 157 waiting times were measured for the control, Src-inhibitor, and Syk-inhibitor samples, respectively. Waiting times are less sensitive than first kill times to partial Src and Syk inhibition, even when total killing is greatly reduced. All error bars in this figure reflect SEs.
Fig. 4.
Fig. 4.
Spatiotemporal coordination of serial killing. (A and B) Scatterplots of distance and time between subsequent HeLa (A) or MCF7 (B) targets. Trendlines (red) of the log-transformed data indicate relatively uniform distances to the next target over two order of magnitude of waiting times. (C) The distance between the first observed kill (blue) and the effector (red) is measured at the end of a time course. (D and E) Five hundred fluorescent HeLa cells stably expressing the GzmB reporter are plated in the well of a 96-well plate either in isolation (D) or on a confluent background of nonfluorescent HeLa cells (E). Distances between the centers of effectors and their first fluorescent targets are recorded at the end of a 6-h assay. Effectors do not detach after killing isolated targets but readily release killed targets in the presence of dense adjacent targets. (F) The average distance and time interval between subsequent targets and the first target are plotted for HeLa (black dots) and MCF7 (red dots) to illustrate the propagation of serial killing activity. In comparison, the average cell motilities are plotted for HeLa (black line) and MCF7 (red line). Although average motilities differ on the two targets, killing activity propagates in a similar, accelerated manner.
Fig. 5.
Fig. 5.
Bursting kinetics in serial killing by the YTS NK line on a slower timescale. (A) Histogram of kill count, k, for the total number of targets killed by individual effector cells over 18 h of coincubation of 1,000 YTS cells and 2 × 10⁴ HeLa cells per well of a 96-well plate. For all following histograms, mean values and associated SEs are indicated in red, whereas n indicates the total number of YTS effectors profiled. (B) Histogram of waiting times for HeLa targets attacked by YTS effectors. The sample size n denotes the total number of waiting times recorded when two killing events occur in succession. (C) Histogram of first kill times for HeLa targets attacked by YTS effectors. The sample size n denotes the total number of first kill times measured, which is equivalent to the number of NK cells with k > 0. When serial killing occurs, the waiting time between subsequent kills is typically much faster than the time needed for the first kill.

References

    1. Dunn GP, Bruce AT, Ikeda H, Old LJ, Schreiber RD. Cancer immunoediting: From immunosurveillance to tumor escape. Nat Immunol. 2002;3(11):991–998. - PubMed
    1. Grakoui A, et al. The immunological synapse: A molecular machine controlling T cell activation. Science. 1999;285(5425):221–227. - PubMed
    1. Davis DM, et al. The human natural killer cell immune synapse. Proc Natl Acad Sci USA. 1999;96(26):15062–15067. - PMC - PubMed
    1. Zagury D, Bernard J, Thierness N, Feldman M, Berke G. Isolation and characterization of individual functionally reactive cytotoxic T lymphocytes: Conjugation, killing and recycling at the single cell level. Eur J Immunol. 1975;5(12):818–822.
    1. Sanderson CJ. The mechanism of T cell mediated cytotoxicity. II. Morphological studies of cell death by time-lapse microcinematography. Proc R Soc Lond B Biol Sci. 1976;192(1107):241–255. - PubMed

Publication types