

Syndromic surveillance using veterinary laboratory data: data pre-processing and algorithm performance evaluation
- PMID: 23576782
- PMCID: PMC3645420
- DOI: 10.1098/rsif.2013.0114
Syndromic surveillance using veterinary laboratory data: data pre-processing and algorithm performance evaluation
Abstract
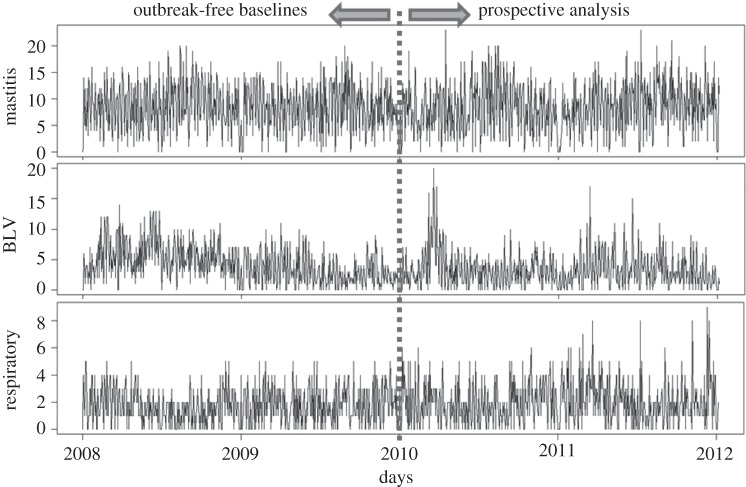
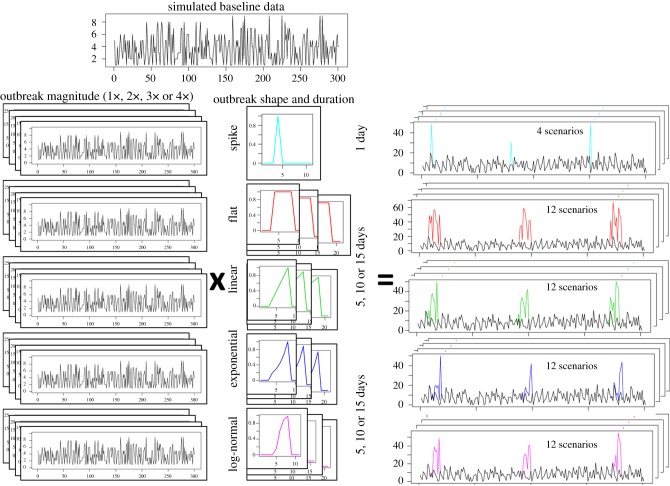
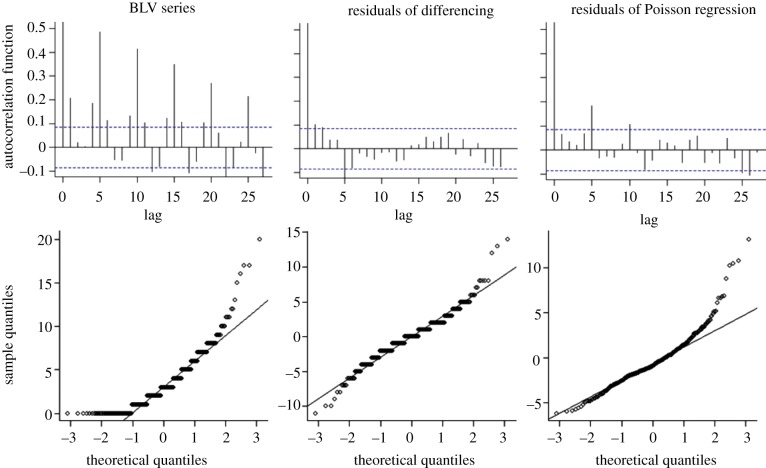
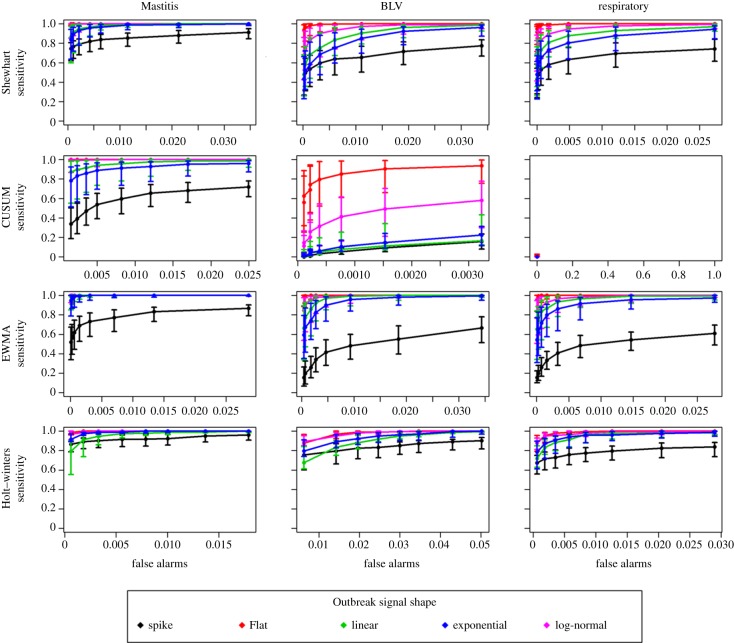
Diagnostic test orders to an animal laboratory were explored as a data source for monitoring trends in the incidence of clinical syndromes in cattle. Four years of real data and over 200 simulated outbreak signals were used to compare pre-processing methods that could remove temporal effects in the data, as well as temporal aberration detection algorithms that provided high sensitivity and specificity. Weekly differencing demonstrated solid performance in removing day-of-week effects, even in series with low daily counts. For aberration detection, the results indicated that no single algorithm showed performance superior to all others across the range of outbreak scenarios simulated. Exponentially weighted moving average charts and Holt-Winters exponential smoothing demonstrated complementary performance, with the latter offering an automated method to adjust to changes in the time series that will likely occur in the future. Shewhart charts provided lower sensitivity but earlier detection in some scenarios. Cumulative sum charts did not appear to add value to the system; however, the poor performance of this algorithm was attributed to characteristics of the data monitored. These findings indicate that automated monitoring aimed at early detection of temporal aberrations will likely be most effective when a range of algorithms are implemented in parallel.
Figures
Similar articles
-
Syndromic surveillance using veterinary laboratory data: algorithm combination and customization of alerts.PLoS One. 2013 Dec 11;8(12):e82183. doi: 10.1371/journal.pone.0082183. eCollection 2013. PLoS One. 2013. PMID: 24349216 Free PMC article.
-
Methodological challenges to multivariate syndromic surveillance: a case study using Swiss animal health data.BMC Vet Res. 2016 Dec 20;12(1):288. doi: 10.1186/s12917-016-0914-2. BMC Vet Res. 2016. PMID: 27998276 Free PMC article.
-
Multivariate syndromic surveillance for cattle diseases: Epidemic simulation and algorithm performance evaluation.Prev Vet Med. 2019 Nov 15;172:104778. doi: 10.1016/j.prevetmed.2019.104778. Epub 2019 Sep 21. Prev Vet Med. 2019. PMID: 31586719
-
Cluster Detection Mechanisms for Syndromic Surveillance Systems: Systematic Review and Framework Development.JMIR Public Health Surveill. 2020 May 26;6(2):e11512. doi: 10.2196/11512. JMIR Public Health Surveill. 2020. PMID: 32357126 Free PMC article.
-
Outbreak detection through automated surveillance: a review of the determinants of detection.J Biomed Inform. 2007 Aug;40(4):370-9. doi: 10.1016/j.jbi.2006.09.003. Epub 2006 Oct 5. J Biomed Inform. 2007. PMID: 17095301 Review.
Cited by
-
Pilot simulation study using meat inspection data for syndromic surveillance: use of whole carcass condemnation of adult cattle to assess the performance of several algorithms for outbreak detection.Epidemiol Infect. 2015 Sep;143(12):2559-69. doi: 10.1017/S0950268814003495. Epub 2015 Jan 8. Epidemiol Infect. 2015. PMID: 25566974 Free PMC article.
-
Enhancing the monitoring of fallen stock at different hierarchical administrative levels: an illustration on dairy cattle from regions with distinct husbandry, demographical and climate traits.BMC Vet Res. 2020 Apr 14;16(1):110. doi: 10.1186/s12917-020-02312-8. BMC Vet Res. 2020. PMID: 32290840 Free PMC article.
-
A simulation study to evaluate the performance of five statistical monitoring methods when applied to different time-series components in the context of control programs for endemic diseases.PLoS One. 2017 Mar 6;12(3):e0173099. doi: 10.1371/journal.pone.0173099. eCollection 2017. PLoS One. 2017. PMID: 28264002 Free PMC article.
-
Evaluation of a Multivariate Syndromic Surveillance System for West Nile Virus.Vector Borne Zoonotic Dis. 2016 Jun;16(6):382-90. doi: 10.1089/vbz.2015.1883. Epub 2016 May 9. Vector Borne Zoonotic Dis. 2016. PMID: 27159212 Free PMC article.
-
Designing a Syndromic Bovine Mortality Surveillance System: Lessons Learned From the 1-Year Test of the French OMAR Alert Tool.Front Vet Sci. 2020 Jan 9;6:453. doi: 10.3389/fvets.2019.00453. eCollection 2019. Front Vet Sci. 2020. PMID: 31998757 Free PMC article.
References
-
- Bravata DM, McDonald KM, Smith WM, Rydzak C, Szeto H, Buckeridge DL, Haberland C, Owens DK. 2004. Systematic review: surveillance systems for early detection of bioterrorism-related diseases. Ann. Intern. Med. 140, 910–922 - PubMed
-
- Shmueli G, Burkom H. 2010. Statistical challenges facing early outbreak detection in biosurveillance. Technometrics 52, 39–5110.1198/TECH.2010.06134 (doi:10.1198/TECH.2010.06134) - DOI - DOI
-
- Centers for Disease Control and Prevention (CDC) 2006. Annotated bibliography for syndromic surveillance. See http://www.cdc.gov/ncphi/disss/nndss/syndromic.htm .
-
- Benneyan JC. 1998. Statistical quality control methods in infection control and hospital epidemiology. I. Introduction and basic theory. Infect. Control Hospital Epidemiol. 19, 194–21410.1086/647795 (doi:10.1086/647795) - DOI - DOI - PubMed
-
- Woodall WH. 2006. Use of control charts in health-care and public-health surveillance. J. Quality Technol. 38, 89–104
Publication types
MeSH terms
LinkOut - more resources
Full Text Sources
Other Literature Sources
