. 2013 Apr 10;5(180):180ra48.
doi: 10.1126/scitranslmed.3005109.

The identification and characterization of breast cancer CTCs competent for brain metastasis

Affiliations

The identification and characterization of breast cancer CTCs competent for brain metastasis

Lixin Zhang et al. Sci Transl Med. .

Erratum in

  • Sci Transl Med. 2013 Jun 12;5(189):189er5

Abstract

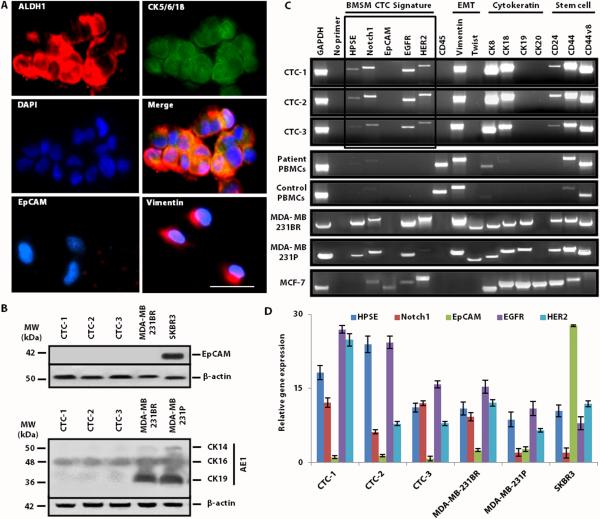
Brain metastatic breast cancer (BMBC) is uniformly fatal and increasing in frequency. Despite its devastating outcome, mechanisms causing BMBC remain largely unknown. The mechanisms that implicate circulating tumor cells (CTCs) in metastatic disease, notably in BMBC, remain elusive. We characterize CTCs isolated from peripheral blood mononuclear cells of patients with breast cancer and also develop CTC lines from three of these patients. In epithelial cell adhesion molecule (EpCAM)-negative CTCs, we identified a potential signature of brain metastasis comprising "brain metastasis selected markers (BMSMs)" HER2+ / EGFR+ / HPSE+ / Notch1+. These CTCs, which are not captured by the CellSearch platform because of their EpCAM negativity, were analyzed for cell invasiveness and metastatic competency in vivo. CTC lines expressing the BMSM signature were highly invasive and capable of generating brain and lung metastases when xenografted in nude mice. Notably, increased brain metastatic capabilities, frequency, and quantitation were detected in EpCAM- CTCs overexpressing the BMSM signature. The presence of proteins of the BMSM CTC signature was also detected in the metastatic lesions of animals. Collectively, we provide evidence of isolation, characterization, and long-term culture of human breast cancer CTCs, leading to the description of a BMSM protein signature that is suggestive of CTC metastatic competency to the brain.


Figures

Fig. 1
Fig. 1. EGFR amplification and nuclear HPSE expression in PBMCs from metastatic breast cancer patients
(A) Representative image of FISH analyses for EGFR amplification in PBMCs isolated from BMBC patients. EGFR amplification (white arrow) was compared to CEP10/10q signal for ploidy content. (B) Representative FISH and IF analyses of nuclei of CACCs showing EGFR and heparanase (HPSE) expression. EGFR 7p12 was also overlayed with CEP7 to show ploidy content. DAPI staining is in blue. (C) Representative images of IF analyses showing simultaneous expression of HPSE and aldehyde dehydrogenase 1 (ALDH1) in nucleated PBMCs from the blood of patients (n = 8), in PBMCs from patients without breast cancer (n = 8), and in the MDA-MB-231BR cell line. MDA-MB-231BR cells and PBMCs were used as ALDH1-positive and - negative controls, respectively. All scale bars, 20 μm. (D) EGFR-amplified PBMCs isolated from BMBC patients (n = 3) were analyzed for ALDH1 and HPSE expression. The system randomly scanned ~5.0 × 10³ cells for each marker per slide sample. Data are averages ± S.D.
Fig 2
Fig 2. EpCAM CTC characterization and culture from three patients
(A) Immunofluorescence staining of potential CTCs (EpCAM/ALDH1+/CD45) for ALDH1, CK5/6/18, and vimentin expression. Merge panel consists of ALDH1/CK/DAPI–positive IF staining. Scale bar, 50 μm. (B) Western blot for EpCAM and CK14/16/19 in CTC lines. The brain-metastatic MDA-MB-231BR and non-brain-metastatic SKBR3 cell lines were used as positive and negative controls, respectively. β-Actin was the loading control. (C) RT-PCR analyses of CTCs. Selected genes were classified into four groups: BMSM signature, EMT, cytokeratin, and stemness. MDA-MB-231BR (HER2-transfected), MDA-MB-231 parental, and MCF-7 cell lines were used as controls as brain metastatic, poorly brain metastatic, and non-metastatic breast cancer cell lines, respectively. PBMCs isolated from patients with (patient) or without (control) breast cancer were used as negative controls for the BMSM CTC signature. GAPDH was the loading control. Further, CTCs did not express the mesenchymal stem cell (MSC) marker triplet (fig. S2). (D) Real-time PCR analysis of the BMSM gene expression. All cell lines were analyzed and normalized to the expression levels of GAPDH per cell line. Data are means ± SEM (n = 3, four independent experiments). Data displayed in fig. 2C (RT-PCR) were not quantified because the best quantification for markers of the BMSM CTC signature was achieved employing real-time PCR. However, we have quantified the RT-PCR data for CTCs at passage 20 (fig. S3).
Fig. 3
Fig. 3. Sorting and characterization of EpCAM CTCs overexpressing Notch1, EGFR, and HER2 (BMSM CTCs)
(A) Sequential cell sorting for EpCAM/Notch1+ followed by EGFR+/HER2+ to obtain BMSM CTCs. The percentage of positive cells for each sorting is indicated. MCF-7 and SKBR3 cells were used as positive controls for EpCAM and EGFR/HER2, respectively (see also fig. S5). (B) Immunofluorescence staining of cells isolated in (A) for BMSM proteins HPSE, Notch1, EGFR, and HER2. Inset shows ZR75 human breast cancer cells (luminal sub-type) as positive control for EpCAM expression. Scale bar, 100 μm. Fluorescence signal was quantified as percentage of positive cells/microscopy field (8-10 fields/slide). Data are means ± SEM (n = 3)(see also fig. S4 and S6). (C) Fluorescence signal was quantified as percentage of positive cells/microscopy field (8-10 fields/slide). Data are means ± SEM (n = 3) (see also fig. S4 and S6). (D) HPSE activity was measured in BMSM CTCs from (A). Data are means ± SEM (n = 3). Human MCF-7 and MDA MB-231BR cell lines were used as negative and positive controls for HPSE activity, respectively.
Fig. 4
Fig. 4. BMSM CTCs are invasive and metastasize to brain and lung
(A) Representative images of BMBC (inserts) induced by BMSM CTCs when injected intracardiacally into mice. BMBC tumor sections underwent analyses for tumor burden by the CRi Vectra Intelligent system which highlights and enumerates single tumor cells (in green). (B) Representative lung images from BMSM CTC–injected mice in (A) are shown. Lung samples were analyzed concurrently with BMBC and under the same conditions. (C) Quantification of only tumor cells for brain- and lung-metastatic breast cancer arising from both BMSM CTCs and parental CTCs (CTC-1, CTC-2, and CTC-3 cell lines). Data are means ± SEM (n = 8 sections/mouse; 10 mice per CTC line). ***P < 0.001, ANOVA. (D) Chemoinvasion of parental CTCs and BMSM CTCs by Matrigel chamber assays. Invasion was quantified and compared with breast cancer cell lines of known invasive capacity. Data are means ± SEM (n = 8-10 fields/cell line, four independent experiments. *P < 0.05, **P < 0.01 by ANOVA. All scale bars, 100 μm.
Fig. 5
Fig. 5. Histological analyses of CTC tumor xenografts and BMSM CTC signature proteins
This is shown in Figure S8, panel B. Two animals subgroups (n = 5 each) were injected intracardiacally in parallel with either MDA-MB-231BR cells or PBMCs isolated from patients (positive and negative controls for BMBC, respectively). (A) CTCs (parental CTC-1) metastasize to brain in immunocompromised mice (tumor xenografts). Representative images show BMBC macro-metastasis (upper panel) and micro-metastasis (lower panel) surrounded by neuroglial tissue. (B) CTC-induced BMBC displayed a branching pattern indicative of tumor growth along the preexisting vasculature, similar to the clinical presentation of BMBC (upper panel). Further, tumor cell morphology of CTC-induced BMBC closely resembled one of pathologically assessed BMBC of donor patient whose blood was analyzed and CTC isolated from (lower panel). (D) Representative image of BMBC generated from MDA-MB-231BR xenografts (positive control; upper panel). Conversely, no BMBC was observed following the injection of patient PBMCs (negative control, lower panel). (C) Representative image of BMBC from BMSM CTC xenografts and adjacent neuroglial tissue showing an aberrant mitotic figure (yellow arrow, upper panel). Aberrant mitotic figures like starbust mitosis (inset) were detected as hallmark of neoplasticity, and indicated with yellow arrows (lower panel). (E and F) Representative images from murine brain (E) and lung (F) sections from animals injected with BMSM CTC-1 and analyzed for BMSM signature protein expression by IHC (n = 8-10 images/section, 20 sections/mouse)(see also fig. S7 and S8). Graph displays the quantification of staining scores in E of combined BMSM signature protein levels per CTC line per mouse (n = 10 sections per mouse; 10 mice per BMSM CTC line). **p < 0.001. Scale bars, 100 μm.

Comment in

References

    1. Talmadge JE, Fidler I. AACR Centennial Series: The biology of cancer metastasis. Cancer Res. 2010;70(14):5649–69. - PMC - PubMed
    1. Lin NU, Winer EP. Brain metastasis: the HER2 paradigm. Clin. Cancer Res. 2007;13(6):1648–55. - PubMed
    1. Cristofanilli M, Budd GT, Ellis MJ, Stopeck A, Matera J, Miller MC, Reuben JM, Doyle GV, Allard WJ, Terstappen LW, Hayes DF. Circulating tumor cells, disease progression and survival in metastatic breast cancer. New Eng J Med. 2004;351:781–91. - PubMed
    1. Alix-Panabieres C, Schwarzenbach H, Pantel K. Circulating tumor cells and circulating tumor DNA. Annu. Rev. Med. 2012;63:199–215. - PubMed
    1. Mego M, De Giorgi U, Dawood S, Wang X, Valero V, Andreopoulou E, Handy B, Ueno NT, Reuben JM, Cristofanilli M. Characterization of metastatic breast cancer patients with nondetectable circulating tumor cells. Int J Cancer. 2011;129:417–23. - PubMed

Publication types

Substances