. 2013 Apr 9:7:65.
doi: 10.3389/fncir.2013.00065. eCollection 2013.

Fast functional imaging of multiple brain regions in intact zebrafish larvae using selective plane illumination microscopy

Affiliations

Fast functional imaging of multiple brain regions in intact zebrafish larvae using selective plane illumination microscopy

Thomas Panier et al. Front Neural Circuits. .

Abstract

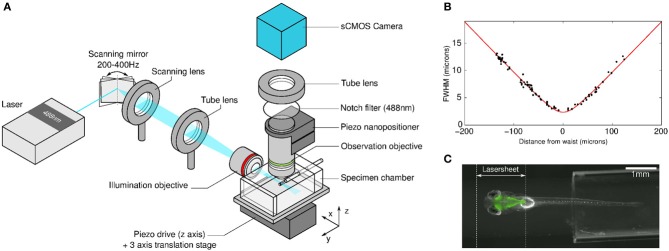
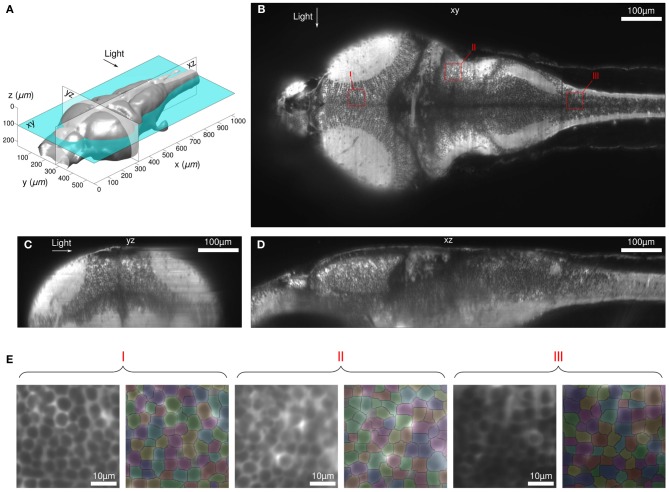
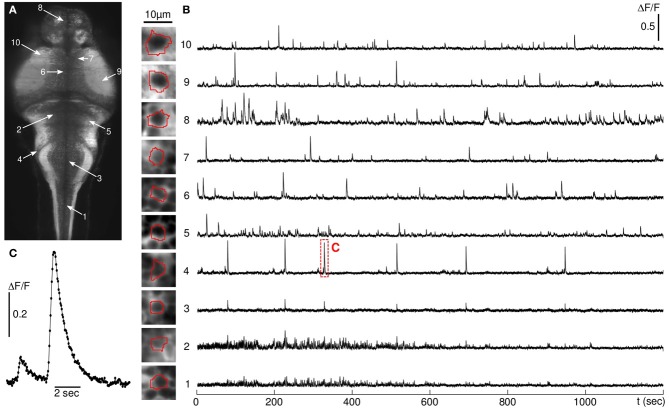
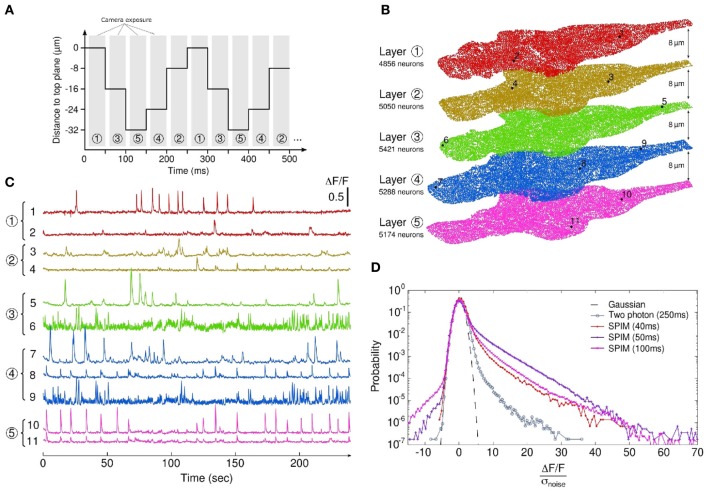
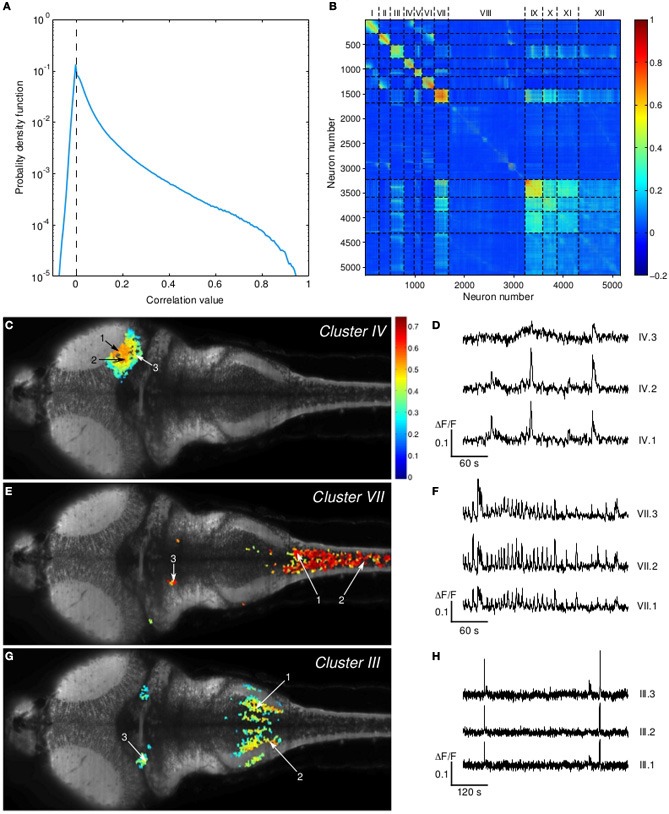
The optical transparency and the small dimensions of zebrafish at the larval stage make it a vertebrate model of choice for brain-wide in-vivo functional imaging. However, current point-scanning imaging techniques, such as two-photon or confocal microscopy, impose a strong limit on acquisition speed which in turn sets the number of neurons that can be simultaneously recorded. At 5 Hz, this number is of the order of one thousand, i.e., approximately 1-2% of the brain. Here we demonstrate that this limitation can be greatly overcome by using Selective-plane Illumination Microscopy (SPIM). Zebrafish larvae expressing the genetically encoded calcium indicator GCaMP3 were illuminated with a scanned laser sheet and imaged with a camera whose optical axis was oriented orthogonally to the illumination plane. This optical sectioning approach was shown to permit functional imaging of a very large fraction of the brain volume of 5-9-day-old larvae with single- or near single-cell resolution. The spontaneous activity of up to 5,000 neurons was recorded at 20 Hz for 20-60 min. By rapidly scanning the specimen in the axial direction, the activity of 25,000 individual neurons from 5 different z-planes (approximately 30% of the entire brain) could be simultaneously monitored at 4 Hz. Compared to point-scanning techniques, this imaging strategy thus yields a ≃20-fold increase in data throughput (number of recorded neurons times acquisition rate) without compromising the signal-to-noise ratio (SNR). The extended field of view offered by the SPIM method allowed us to directly identify large scale ensembles of neurons, spanning several brain regions, that displayed correlated activity and were thus likely to participate in common neural processes. The benefits and limitations of SPIM for functional imaging in zebrafish as well as future developments are briefly discussed.

Keywords: correlation analysis; imaging; light-sheet imaging; neuroimaging; spontaneous activity; three-dimensional; zebrafish model system.


Figures

Figure 1
Figure 1
SPIM-based functional imaging. (A) Sketch of the optical set-up. (B) Laser sheet thickness profile (FWHM) along the light propagation axis. Each data point corresponds to a measurement obtained with one fluorescent bead. The red curve is the best fit of the data with the theoretical profile of a Gaussian focused beam (see Truong et al., 2011) from which the value of the waist's FWHM = 2.3 μm is deduced. (C) Low magnification image of the larva embedded in the agarose gel cylinder and illuminated by the light sheet.
Figure 2
Figure 2
Stack and segmentation. (A–D) Multi-view sections of the brain-volume reconstructed from a complete 3D stack (no filtering). The voxel volume is 0.4× 0.4 × 0.4 μm3. See Supplementary Movie 1 for a complete visualization of the brain. (E) Result of the segmentation algorithm for 3 different sub-regions shown in (B) with red-squares.
Figure 3
Figure 3
Fluorescence signals. (A) Time-averaged image of a brain slice of a 6 dpf larva. (B) Individual traces of 10 neurons whose locations are indicated in red on the image, recorded at 20 Hz acquisition rate. the thumbnails display each neuron's ROI. (C) Blow-up view of a typical activity-related fluorescence event indicated by a red rectangle in (B).
Figure 4
Figure 4
3D calcium-imaging. (A) Interlaced sequence of acquisition of 5 z-planes separated by 8 μm intervals. Exposure time is 40 ms and each plane is recorded at a rate of 4 Hz. (B) Localization of the monitored ROIs (somas and neuropil regions) obtained through automatic segmentation on the 5 different planes. The number of actual somas is given for each z-plane, yielding a total of 25789 simultaneously recorded neurons (see Supplementary Movie 3 for the 5 z-frames fluorescence dynamics). (C) Characteristic signals from neurons within the stack. (D) Comparison of the noise-normalized fluorescence signal distributions for SPIM-based experiments (colored) and a 2P-PSM experiment (gray). For each experiment, the exposure time is indicated. The 40 ms-exposure SPIM experiment is the 3D imaging run (5 z-planes, 4 Hz effective recording rate).
Figure 5
Figure 5
Activity-correlated neuronal clusters. (A) Distribution of pair-wise correlations. The data were obtained from a 10 Hz, 60 min long experiment on a 6 dpf larva. (B) Correlation matrix sorted using the K-means algorithm with associated cluster partitioning. (C–G) Topographical layouts of clusters IV-VII-III. The color code corresponds to the mean pair-wise correlation value with the neurons from the cluster. For each cluster, 3 short excerpts of fluorescence traces exhibiting clear activity correlation are shown (D–H).

Similar articles

Cited by

References

    1. Ahrens M. B., Li J. M., Orger M. B., Robson D. N., Schier A. F., Engert F., et al. (2012). Brain-wide neuronal dynamics during motor adaptation in zebrafish. Nature 485, 471–477 10.1038/nature11057 - DOI - PMC - PubMed
    1. Aizenberg M., Schuman E. M. (2011). Cerebellar-dependent learning in larval zebrafish. J. Neurosci. 31, 8708–8712 10.1523/JNEUROSCI.6565-10.2011 - DOI - PMC - PubMed
    1. Akerboom J., Chen T.-W., Wardill T. J., Tian L., Marvin J. S., Mutlu S., et al. (2012). Optimization of a GCaMP calcium indicator for neural activity imaging. J. Neurosci. 32, 13819–13840 10.1523/JNEUROSCI.2601-12.2012 - DOI - PMC - PubMed
    1. Alivisatos A., Chun M., Church G. M., Greenspan R. J., Roukes M. L., Yuste R. (2012). The brain activity map project and the challenge of functional connectomics. Neuron 74, 970–974 10.1016/j.neuron.2012.06.006 - DOI - PMC - PubMed
    1. Bollmann J. H., Engert F. (2009). Subcellular topography of visually driven dendritic activity in the vertebrate visual system. Neuron 61, 895–905 10.1016/j.neuron.2009.01.018 - DOI - PMC - PubMed

Publication types

LinkOut - more resources