

Ketamine, Propofol, and the EEG: A Neural Field Analysis of HCN1-Mediated Interactions
- PMID: 23576979
- PMCID: PMC3617565
- DOI: 10.3389/fncom.2013.00022
Ketamine, Propofol, and the EEG: A Neural Field Analysis of HCN1-Mediated Interactions
Abstract
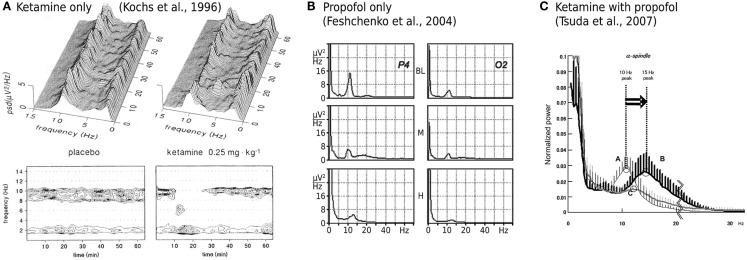
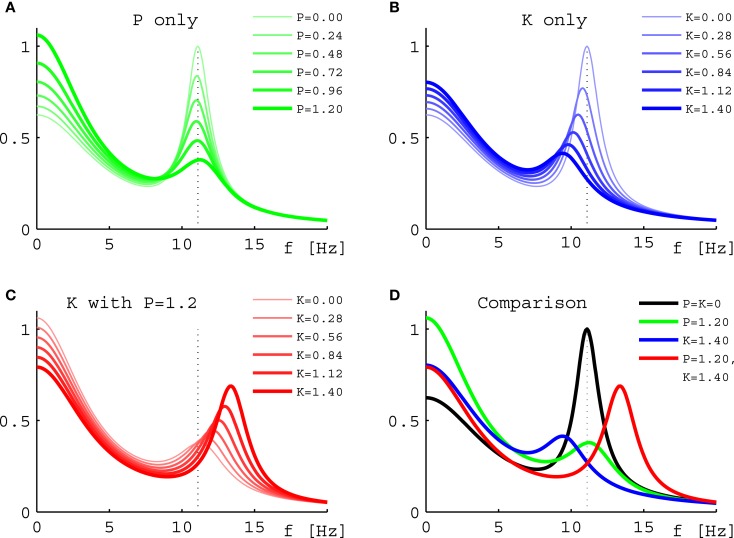
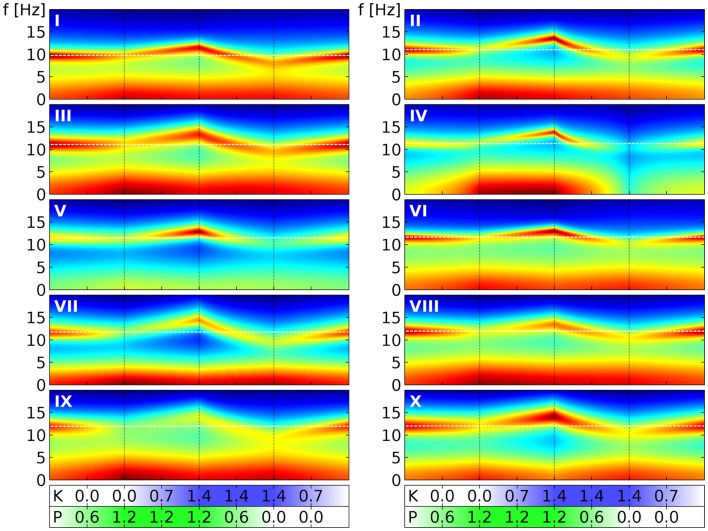
Ketamine and propofol are two well-known, powerful anesthetic agents, yet at first sight this appears to be their only commonality. Ketamine is a dissociative anesthetic agent, whose main mechanism of action is considered to be N-methyl-d-aspartate (NMDA) antagonism; whereas propofol is a general anesthetic agent, which is assumed to primarily potentiate currents gated by γ-aminobutyric acid type A (GABAA) receptors. However, several experimental observations suggest a closer relationship. First, the effect of ketamine on the electroencephalogram (EEG) is markedly changed in the presence of propofol: on its own ketamine increases θ (4-8 Hz) and decreases α (8-13 Hz) oscillations, whereas ketamine induces a significant shift to beta band frequencies (13-30 Hz) in the presence of propofol. Second, both ketamine and propofol cause inhibition of the inward pacemaker current I h, by binding to the corresponding hyperpolarization-activated cyclic nucleotide-gated potassium channel 1 (HCN1) subunit. The resulting effect is a hyperpolarization of the neuron's resting membrane potential. Third, the ability of both ketamine and propofol to induce hypnosis is reduced in HCN1-knockout mice. Here we show that one can theoretically understand the observed spectral changes of the EEG based on HCN1-mediated hyperpolarizations alone, without involving the supposed main mechanisms of action of these drugs through NMDA and GABAA, respectively. On the basis of our successful EEG model we conclude that ketamine and propofol should be antagonistic to each other in their interaction at HCN1 subunits. Such a prediction is in accord with the results of clinical experiment in which it is found that ketamine and propofol interact in an infra-additive manner with respect to the endpoints of hypnosis and immobility.
Keywords: EEG; HCN1; anesthesia; drug interaction; infra-additivity; ketamine; neural field theory; propofol.
Figures
Similar articles
-
HCN1 channel subunits are a molecular substrate for hypnotic actions of ketamine.J Neurosci. 2009 Jan 21;29(3):600-9. doi: 10.1523/JNEUROSCI.3481-08.2009. J Neurosci. 2009. PMID: 19158287 Free PMC article.
-
Ketamine, an NMDA-antagonist, increases the oscillatory frequencies of alpha-peaks on the electroencephalographic power spectrum.Acta Anaesthesiol Scand. 2007 Apr;51(4):472-81. doi: 10.1111/j.1399-6576.2006.01246.x. Acta Anaesthesiol Scand. 2007. PMID: 17378787 Clinical Trial.
-
The spectral exponent of the resting EEG indexes the presence of consciousness during unresponsiveness induced by propofol, xenon, and ketamine.Neuroimage. 2019 Apr 1;189:631-644. doi: 10.1016/j.neuroimage.2019.01.024. Epub 2019 Jan 11. Neuroimage. 2019. PMID: 30639334
-
[Roles of glutamatergic and GABAergic nervous system in hypnotic and analgesic actions of general anesthetics].Masui. 2011 May;60(5):534-43. Masui. 2011. PMID: 21626857 Review. Japanese.
-
[From the racemate to the eutomer: (S)-ketamine. Renaissance of a substance?].Anaesthesist. 1997 Dec;46(12):1026-42. doi: 10.1007/s001010050503. Anaesthesist. 1997. PMID: 9451486 Review. German.
Cited by
-
Neural masses and fields: modeling the dynamics of brain activity.Front Comput Neurosci. 2014 Nov 17;8:149. doi: 10.3389/fncom.2014.00149. eCollection 2014. Front Comput Neurosci. 2014. PMID: 25477813 Free PMC article. No abstract available.
-
In vivo ephaptic coupling allows memory network formation.Cereb Cortex. 2023 Aug 23;33(17):9877-9895. doi: 10.1093/cercor/bhad251. Cereb Cortex. 2023. PMID: 37420330 Free PMC article.
-
Effects of Ketamine on Resting-State EEG Activity and Their Relationship to Perceptual/Dissociative Symptoms in Healthy Humans.Front Pharmacol. 2016 Sep 27;7:348. doi: 10.3389/fphar.2016.00348. eCollection 2016. Front Pharmacol. 2016. PMID: 27729865 Free PMC article.
-
Ketamine-Propofol Coadministration for Induction and Infusion Maintenance in Anesthetized Dogs: Effects on Electroencephalography and Antinociception.Animals (Basel). 2023 Nov 1;13(21):3391. doi: 10.3390/ani13213391. Animals (Basel). 2023. PMID: 37958146 Free PMC article.
-
Common Internal Allosteric Network Links Anesthetic Binding Sites in a Pentameric Ligand-Gated Ion Channel.PLoS One. 2016 Jul 12;11(7):e0158795. doi: 10.1371/journal.pone.0158795. eCollection 2016. PLoS One. 2016. PMID: 27403526 Free PMC article.
References
LinkOut - more resources
Full Text Sources
Other Literature Sources