

A general and robust ray-casting-based algorithm for triangulating surfaces at the nanoscale
- PMID: 23577073
- PMCID: PMC3618509
- DOI: 10.1371/journal.pone.0059744
A general and robust ray-casting-based algorithm for triangulating surfaces at the nanoscale
Abstract
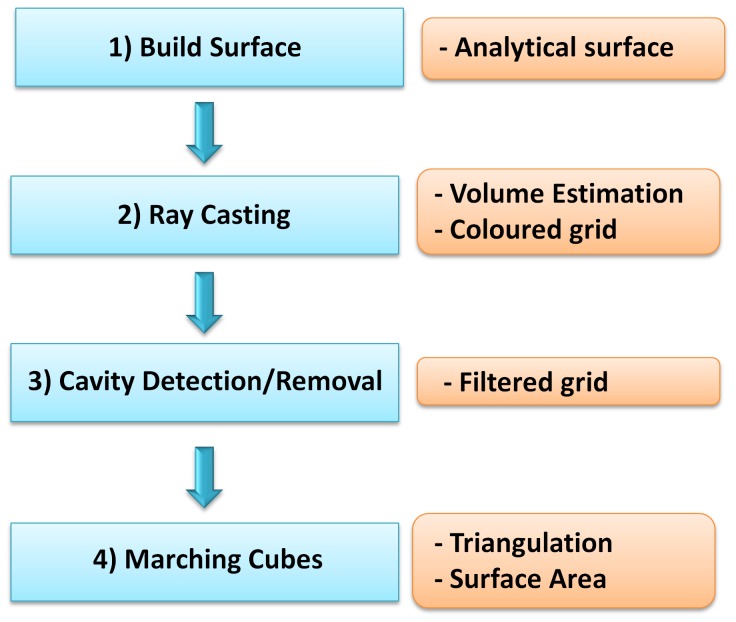
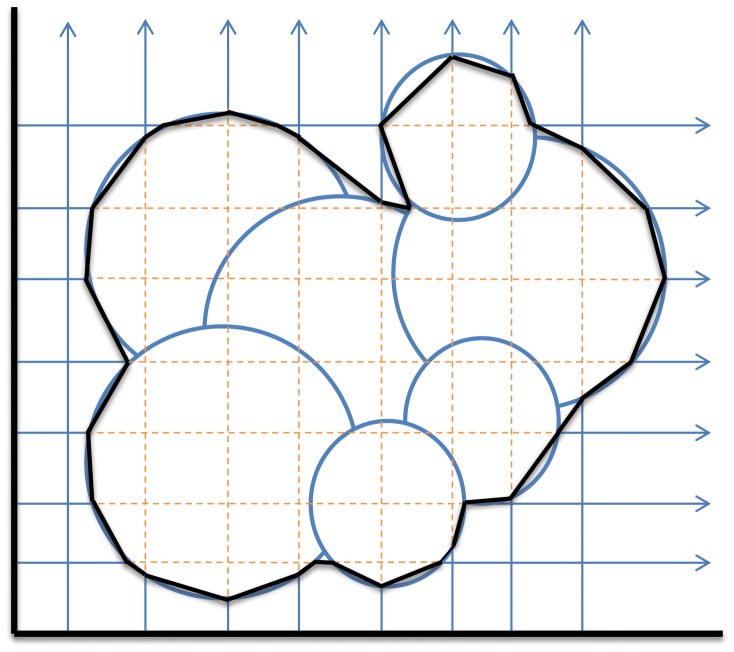
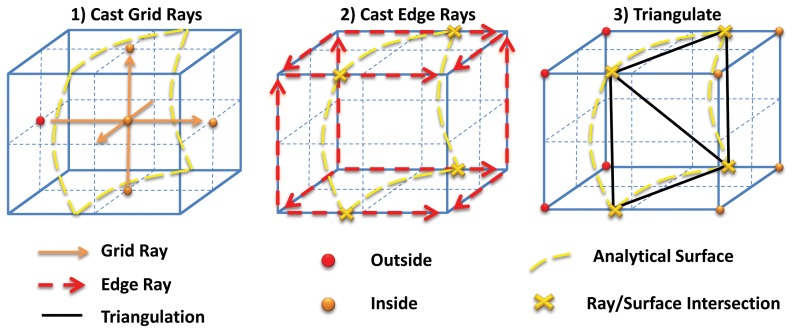
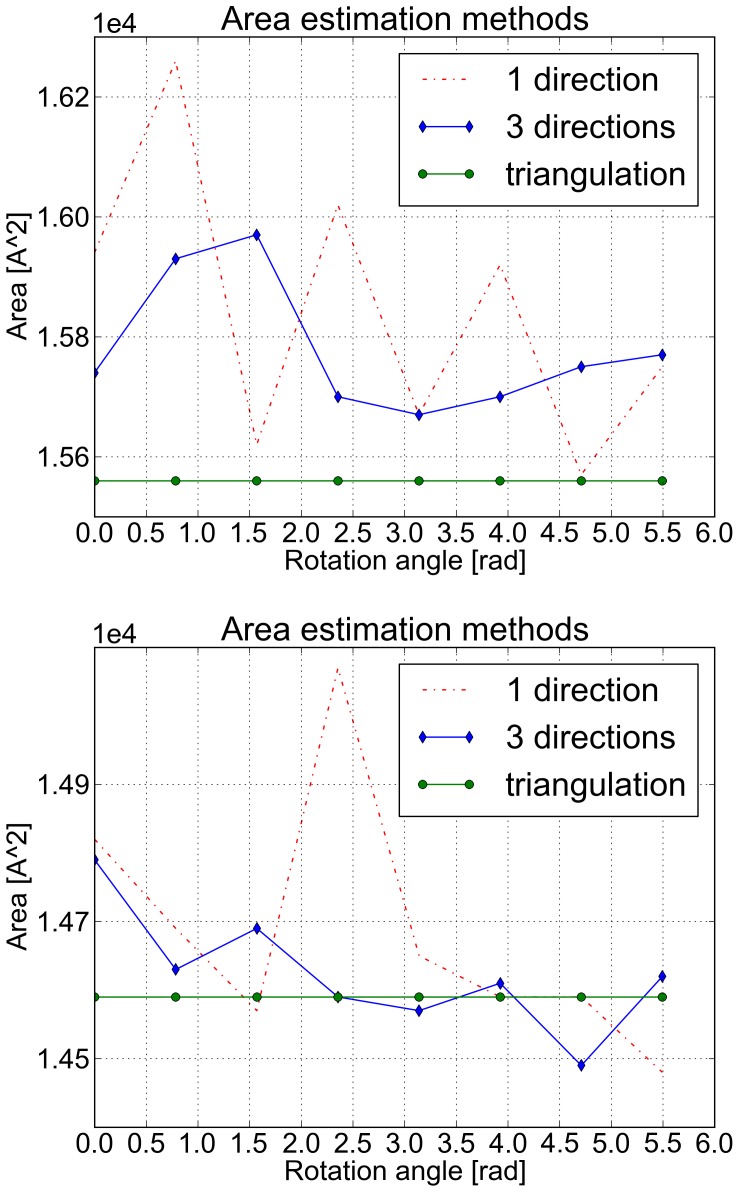
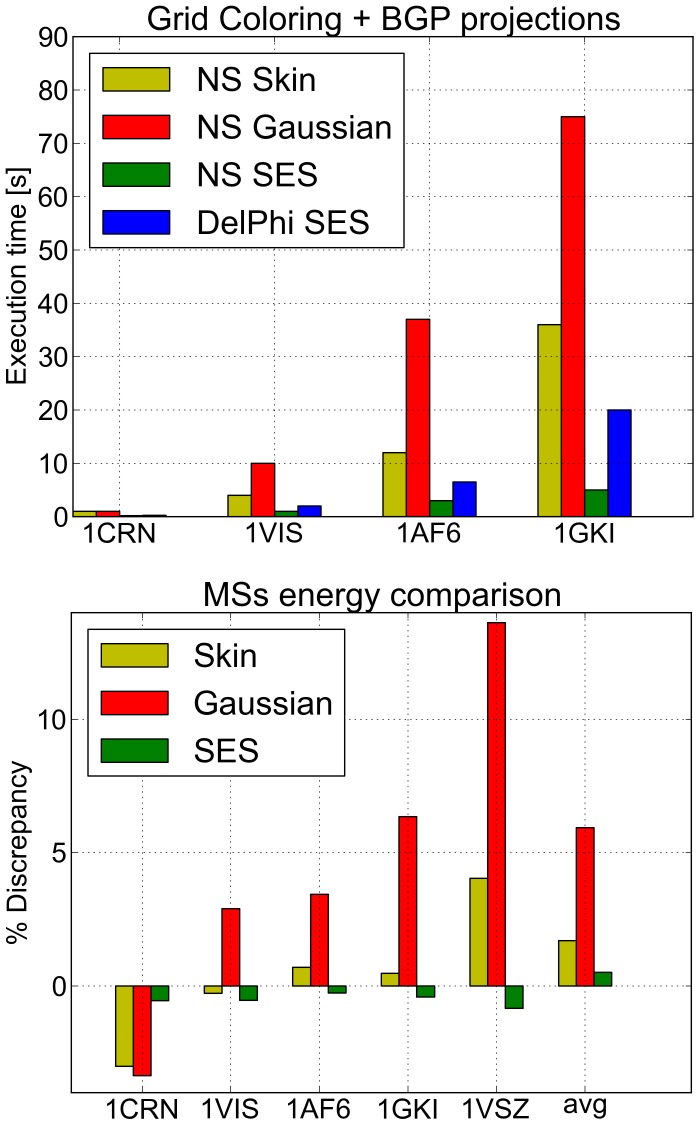
We present a general, robust, and efficient ray-casting-based approach to triangulating complex manifold surfaces arising in the nano-bioscience field. This feature is inserted in a more extended framework that: i) builds the molecular surface of nanometric systems according to several existing definitions, ii) can import external meshes, iii) performs accurate surface area estimation, iv) performs volume estimation, cavity detection, and conditional volume filling, and v) can color the points of a grid according to their locations with respect to the given surface. We implemented our methods in the publicly available NanoShaper software suite (www.electrostaticszone.eu). Robustness is achieved using the CGAL library and an ad hoc ray-casting technique. Our approach can deal with any manifold surface (including nonmolecular ones). Those explicitly treated here are the Connolly-Richards (SES), the Skin, and the Gaussian surfaces. Test results indicate that it is robust to rotation, scale, and atom displacement. This last aspect is evidenced by cavity detection of the highly symmetric structure of fullerene, which fails when attempted by MSMS and has problems in EDTSurf. In terms of timings, NanoShaper builds the Skin surface three times faster than the single threaded version in Lindow et al. on a 100,000 atoms protein and triangulates it at least ten times more rapidly than the Kruithof algorithm. NanoShaper was integrated with the DelPhi Poisson-Boltzmann equation solver. Its SES grid coloring outperformed the DelPhi counterpart. To test the viability of our method on large systems, we chose one of the biggest molecular structures in the Protein Data Bank, namely the 1VSZ entry, which corresponds to the human adenovirus (180,000 atoms after Hydrogen addition). We were able to triangulate the corresponding SES and Skin surfaces (6.2 and 7.0 million triangles, respectively, at a scale of 2 grids per Å) on a middle-range workstation.
Conflict of interest statement
Figures
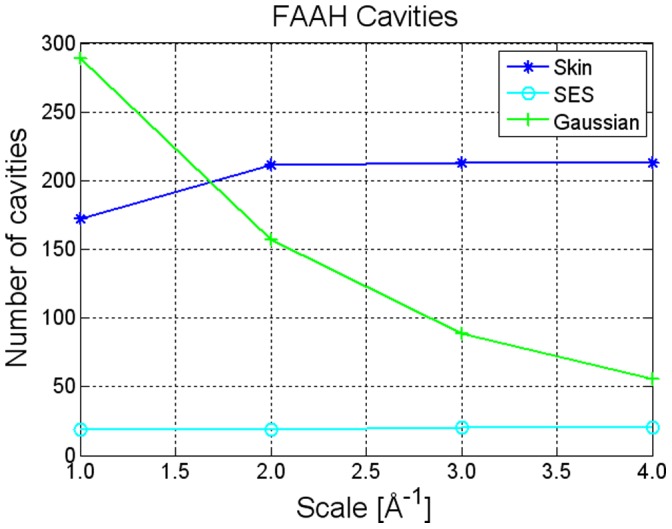
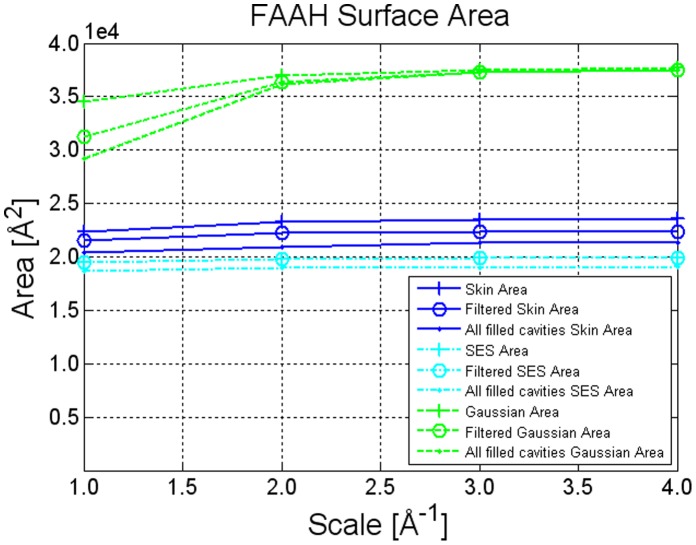
 ), Gaussian
  , and SES (probe radius
  Å), with changing grid resolution and enabling cavity removal.
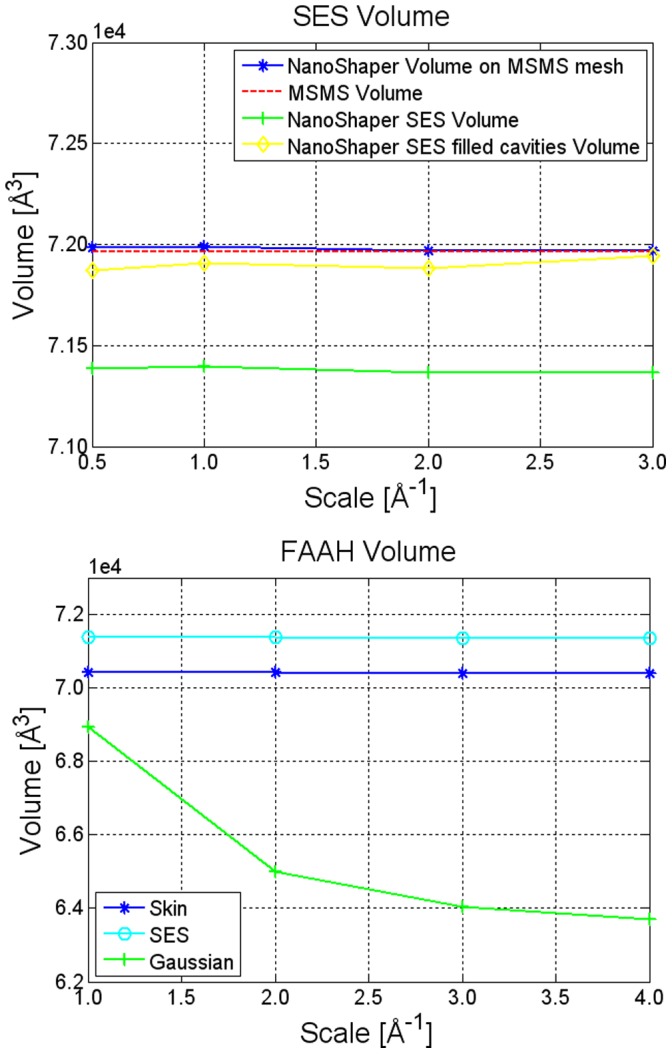
 , for the Gaussian a value of B =
  , and for the SES a probe radius of
  Å.
Å.
References
-
- Richards F (1977) Areas, volumes, packing, and protein structure. Annual Review of Biophysics and Bioengineering 6: 151–176. - PubMed
-
- Connolly M (1983) Analytical molecular surface calculation. J Appl Cryst 16: 548–558.
-
- Bates P, Wei G, Zhao S (2008) Minimal molecular surfaces and their applications. Journal of Computational Chemistry 29: 380–391. - PubMed
-
- Blinn JF (1982) A generalization of algebraic surface drawing. ACM Transactions on Graphics 1: 235–256.
Publication types
MeSH terms
Substances
Grants and funding
LinkOut - more resources
Full Text Sources
Other Literature Sources
