. 2013;8(4):e59778.
doi: 10.1371/journal.pone.0059778. Epub 2013 Apr 5.

Autocrine regulation of macrophage activation via exocytosis of ATP and activation of P2Y11 receptor

Affiliations

Autocrine regulation of macrophage activation via exocytosis of ATP and activation of P2Y11 receptor

Hayato Sakaki et al. PLoS One. 2013.

Abstract

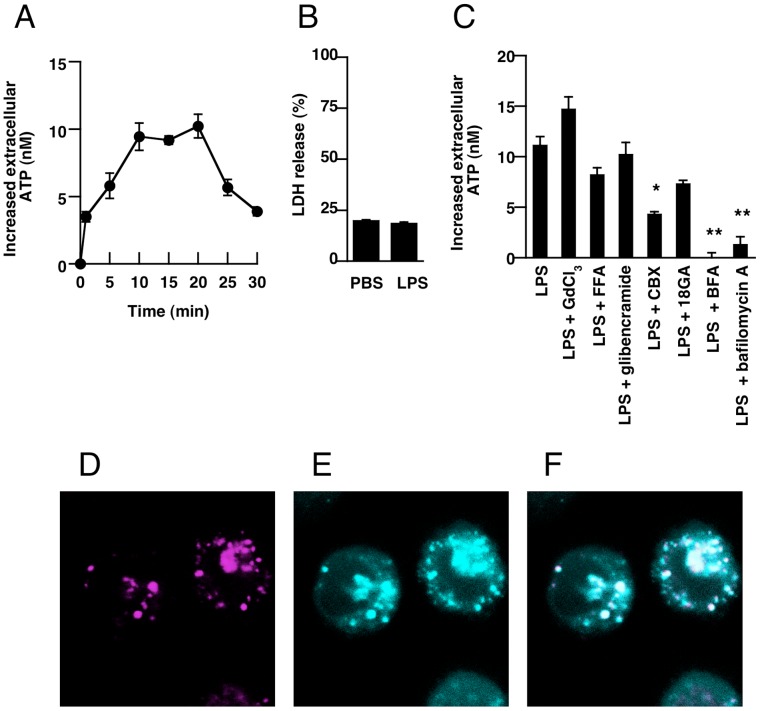
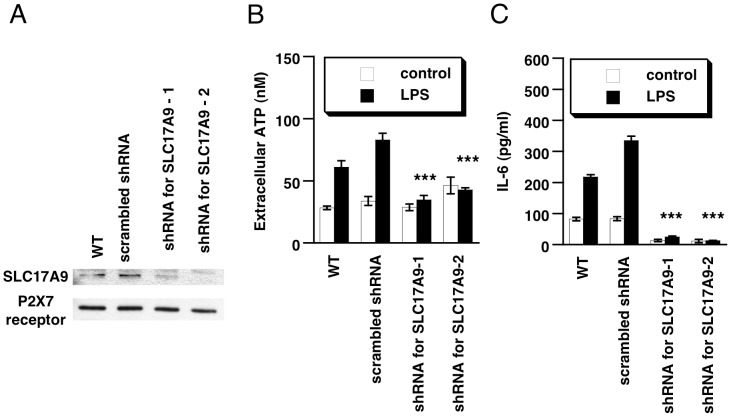
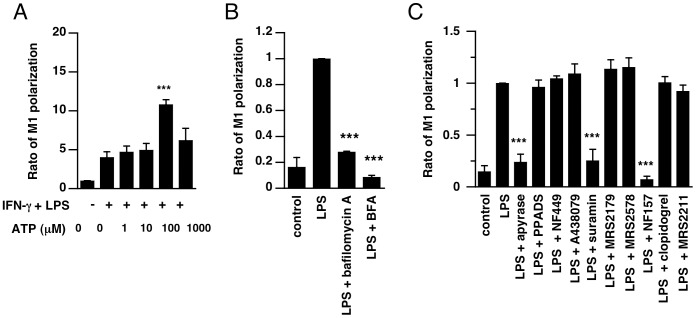
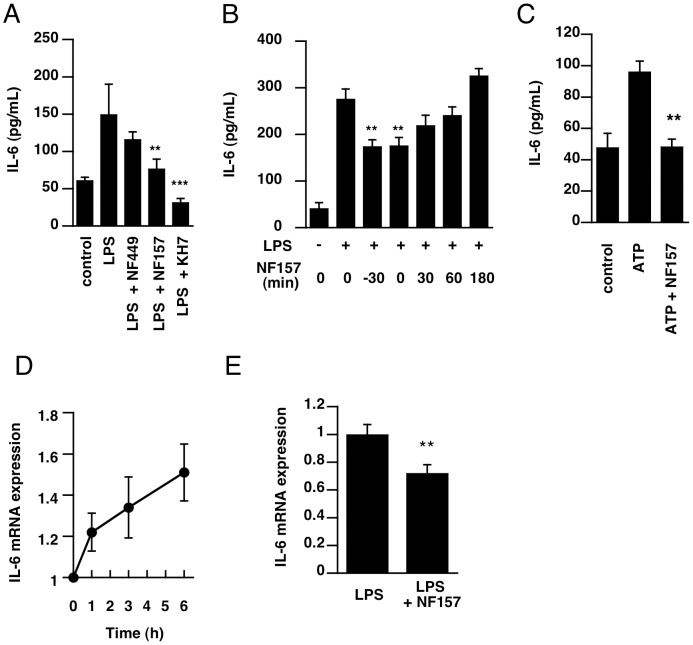
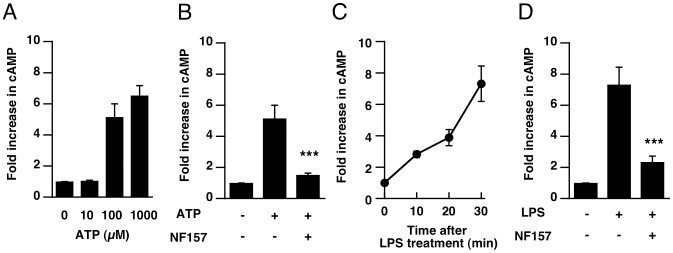
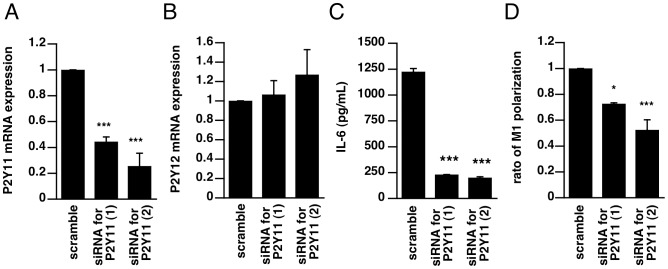
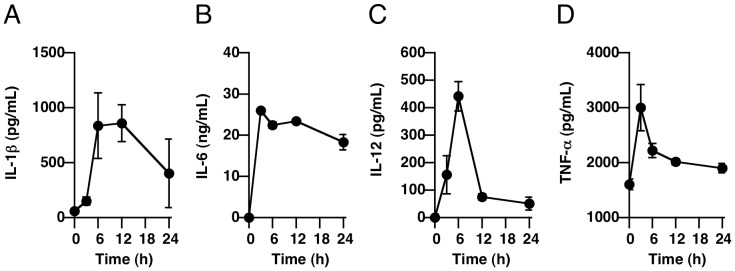
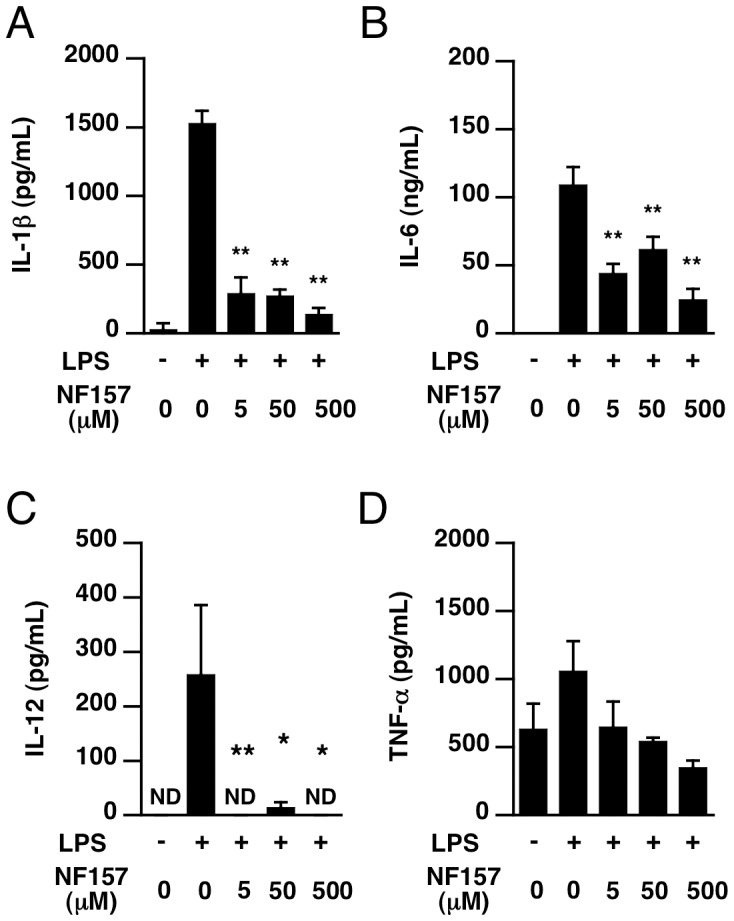
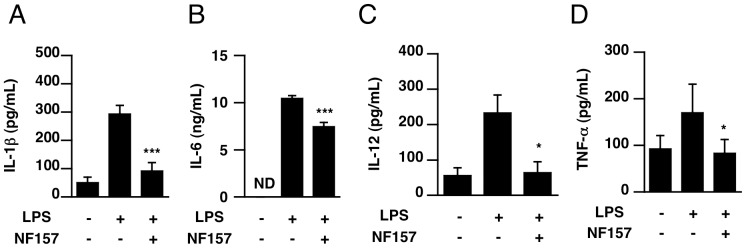
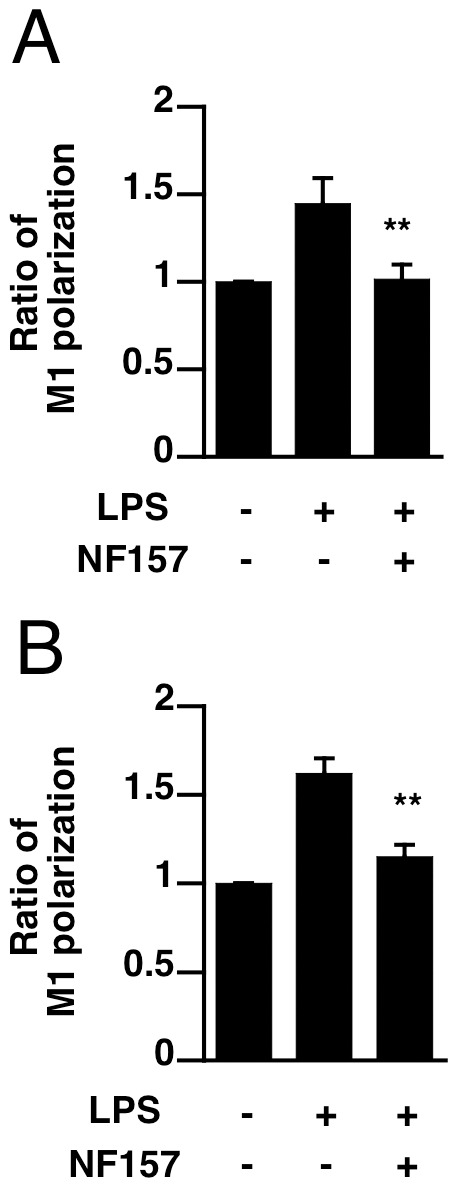
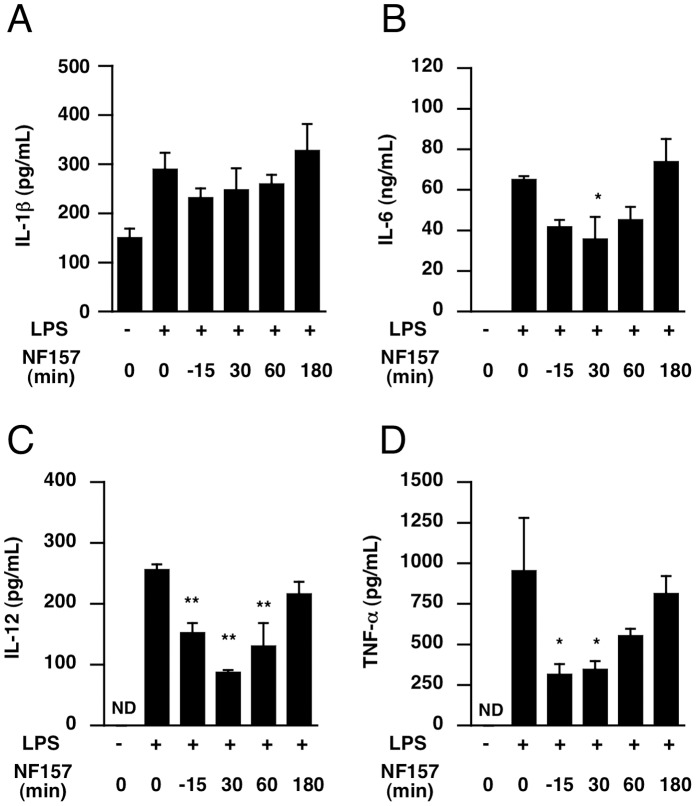
It is important to understand the mechanisms that regulate macrophage activation to establish novel therapies for inflammatory diseases, such as sepsis; a systemic inflammatory response syndrome generally caused by bacterial lipopolysaccharide (LPS). In this study, we investigated the involvement of extracellular ATP-mediated autocrine signaling in LPS-induced macrophage activation. We show here that ATP release via exocytosis, followed by activation of P2Y11 receptor, is a major pathway of the macrophage activation, leading to release of cytokines. Treatment of human monocyte THP-1 cells with LPS induced rapid ATP release from cells, and this release was blocked by knockdown of SLC17A9 (vesicular nucleotide transporter, VNUT), which is responsible for exocytosis of ATP. ATP-enriched vesicles were found in cytosol of THP-1 cells. These data suggest the involvement of vesicular exocytosis in the release of ATP. Knockdown of SLC17A9, the P2Y11 antagonist NF157 or knockdown of P2Y11 receptor significantly suppressed both M1-type polarization and IL-6 production in THP-1 cells, indicating an important role of activation of P2Y11 receptor by released ATP in macrophage activation. Next, the effect of NF157 on LPS-induced immune activation was examined in vivo. Administration of LPS to mice caused increase of serum IL-1ß, IL-6, IL-12 and TNF-alpha levels at 3-24 h after the administration. Pre-treatment of LPS-treated mice with NF157 suppressed both elevation of proinflammatory cytokines in serum and M1 polarization of peritoneal/spleen macrophages. Moreover, post-treatment with NF157 at 30 min after administration of LPS also suppressed the elevation of serum cytokines levels. We conclude that vesicular exocytosis of ATP and autocrine, positive feedback through P2Y11 receptors is required for the effective activation of macrophages. Consequently, P2Y11 receptor antagonists may be drug candidates for treatment of inflammatory diseases such as sepsis.


Conflict of interest statement

Competing Interests: The authors have declared that no competing interests exist.

Figures

Figure 1
Figure 1. LPS-induced ATP release from THP-1 cells.
(A) Cells were stimulated with LPS (10 µg/mL) and incubated for the indicated times, then the concentration of ATP in the culture medium was measured as described in Materials and Methods. (B) Cells were incubated with PBS or LPS for 30 min. At the end of incubation, supernatants were collected and LDH content was measured. The release of LDH is expressed as a percentage of total content determined by lysing an equal number of cells with 1% Triton X-100. (C) Cells were pretreated with GdCl3 (100 µM), FFA (50 µM), glibenclamide (100 µM), CBX (50 µM), 18GA (50 µM), BFA (10 µM) or bafilomycin A (50 nM) for 30 min. At 10 min after LPS stimulation, supernatants were collected and ATP contents were measured. (D–F) Cells were stained with MANT-ATP (50 µM, cyan, panel C) and quinacrine dihydrochloride (5 µM, magenta, panel D) for 1 h at 37°C. Then, stained cells were analyzed using a confocal laser scanning microscopy. The merged image is shown in panel E. Each value represents the mean ± SE (n = 4–8). Significant differences between the indicated groups and control group (LPS alone) are indicated by *(p<0.05) and **(P<0.01), respectively.
Figure 2
Figure 2. SLC17A9 is involved in LPS-induced ATP release and IL-6 production in THP-1 cells.
(A) THP-1 cells were transfected with 2 µg of two different shRNAs targeting SLC17A9 (No. 1 or No. 2) or scramble shRNA. Seventy-two hours after transfection, cellular membrane proteins were extracted and the expression of SLC17A9 was detected by immunoblotting as described in Materials and Methods. (B) THP-1 cells transfected with two different shRNAs targeting SLC17A9 or the negative control shRNA were stimulated with LPS. At 10 min after LPS stimulation, the supernatants were collected and ATP content was measured (n = 8–12). (C) The shRNA-transfected cells were incubated with LPS for 24 h, and then the concentration of IL-6 in culture medium was measured by ELISA (n = 10–14). Each value represents the mean ± SE. Significant differences between the control group (scramble) and the indicated group are indicated by ***(p<0.001).
Figure 3
Figure 3. Extracellular ATP contributes to M1 macrophage polarization via activation of P2 receptors.
(A–C) THP-1 cells were cultured for 24 h in medium or in medium supplemented with LPS and IFN-gamma in the absence or presence of ATP (A), or bafilomycin A (50 nM), BFA (10 µM) (B), apyrase (25 U/mL), PPADS (100 µM), A438079 (100 µM), suramin (100 µM), NF449 (10 µM), MRS2179 (100 µM), MRS2578 (10 µM), NF157 (50 µM), clopidogrel (30 µM), or MRS2211 (100 µM) (C). Expression of M1 macrophage marker CCR7 was measured by flow cytometry. The supernatants were assayed for IL-6 (n = 8–10). Each value represents the mean ± SE. A significant difference between the control group (non-treated or LPS alone) and a test group is indicated by ***(p<0.001).
Figure 4
Figure 4. Effect of P2Y11 receptor antagonist on LPS-induced IL-6 production in THP-1 cells.
(A) THP-1 cells were pretreated with NF449 (10 µM), NF157 (50 µM), or KH7 (100 µM) for 30 min. (B) Treatment with NF157 was initiated 30 min before to 180 min after the treatment with LPS (10 µg/mL). At 24 h after LPS stimulation, supernatants were collected and the concentration of IL-6 was measured by ELISA. (C) Cells were pre-treated with NF157 for 30 min, and then incubated with 100 µM ATP for 24 h. Supernatants were collected and the concentration of IL-6 was measured by ELISA. (D–E) Cells were incubated with LPS (10 µg/mL) for 1–6 h (D). Cells were pre-incubated with NF157, and incubated with LPS for 6 h (E). At the end of incubation, mRNA level of IL-6 was determined by RT2-PCR as described under Materials and Methods. Each value represents the mean ± SE (n = 4–11). Significant differences between a test group and control group (LPS or ATP alone) are indicated by **(p<0.01) and ***(p<0.001), respectively.
Figure 5
Figure 5. P2Y11 antagonist NF157 blocked ATP or LPS-induced increase of cAMP levels in THP-1 cells.
(A) THP-1 cells were incubated with 10–100 µM of ATP for 10 min. (B) Cells were pre-incubated with NF157 (50 µM) for 30 min, and then incubated with 100 µM ATP for 10 min. (C) Cells were incubated with LPS (10 µg/mL) for indicated times. (D) Cells were pr)e-incubated with NF157 for 30 min, and then incubated with LPS. Intracellular cAMP level was measured as described in Materials and Methods. Data is expressed as fold increase in cAMP compared with control. Each value represents the mean ± SE (n = 4). Significant differences between the positive control group (ATP or LPS alone) and the indicated group are indicated by ***(p<0.001).
Figure 6
Figure 6. P2Y11 receptor is involved in IL-6 production and M1 macrophage polarization in THP-1 cells.
(A–B) THP-1 cells were transfected with 3 µg of shRNA targeting P2Y11 (No.1 or No.2) or scramble shRNA. Twenty-four hours after transfection, total RNA was extracted and P2Y11 or P2Y12 gene expression was examined by assessing mRNA levels using real-time PCR. (C, D) Cells were transfected with siRNA targeting P2Y11 (No.1 or No.2) or scramble siRNA and incubated for 72 h. (C) The transfected cells were stimulated with LPS (10 µg/mL) and incubated for 24 h, and then the concentration of IL-6 in culture medium was measured by ELISA. (D) The transfected cells were cultured for 24 h in medium or in medium supplemented with LPS and IFN-gamma. Expression of M1 macrophage marker CCR7 was measured by flow cytometry. Each value represents the mean ± SE (n = 4–8). Significant differences between a test group and control group (scramble) are indicated by *(p<0.05) and ***(p<0.001), respectively.
Figure 7
Figure 7. LPS treatment induced increased serum levels of cytokines.
(AD) Male C57BL/6 mice at 6 weeks of age were given LPS (400 µg/head i.p.), and blood samples were collected at 3, 6, 12, and 24 h after LPS injection. Serum levels of IL-1ß, IL-6, IL-12 and TNF-alpha were determined as described in Materials and Methods.
Figure 8
Figure 8. P2Y11 antagonist NF157 suppressed the increase in serum levels of cytokines in LPS-treated mice.
(AD) Male C57BL/6 mice at 6 weeks of age were given LPS (400 µg/head i.p.). NF157 (100 µL) doses of 5, 50 and 500 µM were administered intraperitoneally at 2 h before LPS was injected. Blood samples were collected at 6 h after LPS injection. Serum levels of IL-1ß, IL-6, IL-12 and TNF-alpha were determined as described in Materials and Methods. Each value represents the mean ± SE (n = 4). Significant differences between a test group and control group (LPS alone) are indicated by *(p<0.05) and **(p<0.01), respectively.
Figure 9
Figure 9. P2Y11 antagonist NF157 blocked the increase in peritoneal levels of cytokines in LPS-treated mice. (A
D) Male C57BL/6 mice were injected intraperitoneally with LPS (400 µg/head i.p.). NF157 (100 µL of 500 µM) was administered i.p. at 2 h before LPS was injected. Peritoneal lavage fluid was collected 6 h after LPS injection for measurement of IL-1ß, IL-6, IL-12 and TNF-alpha. Each value represents the mean ± SE (n = 4). Significant differences between a test group and control group (LPS alone) are indicated by *(p<0.05) and ***(p<0.001), respectively.
Figure 10
Figure 10. NF157 blocked M1 polarization of macrophages in LPS-treated mice.
(A, B) Peritoneal and splenic macrophages were isolated from mice 24 h after LPS injection, and analyzed by flow cytometry for the expression of CCR7. Each value represents the mean ± SE. A significant difference between the positive control group (LPS alone) and the indicated group is indicated by **(p<0.01).
Figure 11
Figure 11. Suppressive effect of post-treatment with NF157 on serum levels of cytokines in LPS-treated mice.
(AD) Male C57BL/6 mice at 6 weeks of age were given LPS (400 µg/head i.p.). Treatment with NF157 was initiated 15 min before to 180 min after the onset of LPS injection. Blood samples were collected at 6 h after LPS injection. Serum levels of IL-1ß, IL-6, IL-12 and TNF-alpha were determined as described in Materials and Methods. Each value represents the mean ± SE (n = 4). Significant differences between a test group and control group (LPS alone) are indicated by *(p<0.05) and **(p<0.01), respectively.

Similar articles

Cited by

References

    1. Cohen J (2002) The immunopathogenesis of sepsis. Nature 420: 885–891. - PubMed
    1. Kilbourn RG, Griffith OW, Gross SS (1993) Pathogenetic mechanisms of septic shock. N Engl J Med 329: 1427–1428. - PubMed
    1. Hotchkiss RS, Karl IE (2003) The pathophysiology and treatment of sepsis. N Engl J Med 348: 138–150. - PubMed
    1. Riedemann NC, Guo RF, Ward PA (2003) The enigma of sepsis. J Clin Invest 112: 460–467. - PMC - PubMed
    1. Glauser MP (1996) The inflammatory cytokines. New developments in the pathophysiology and treatment of septic shock. Drugs 52 Suppl 29–17. - PubMed

Publication types

MeSH terms

LinkOut - more resources