

Selectivity to translational egomotion in human brain motion areas
- PMID: 23577096
- PMCID: PMC3618224
- DOI: 10.1371/journal.pone.0060241
Selectivity to translational egomotion in human brain motion areas
Abstract
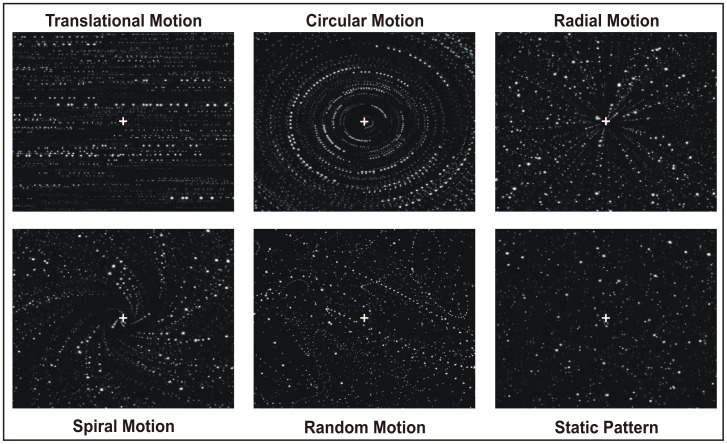
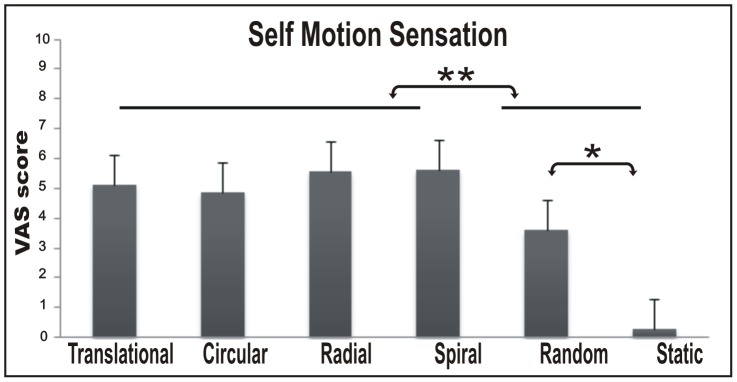
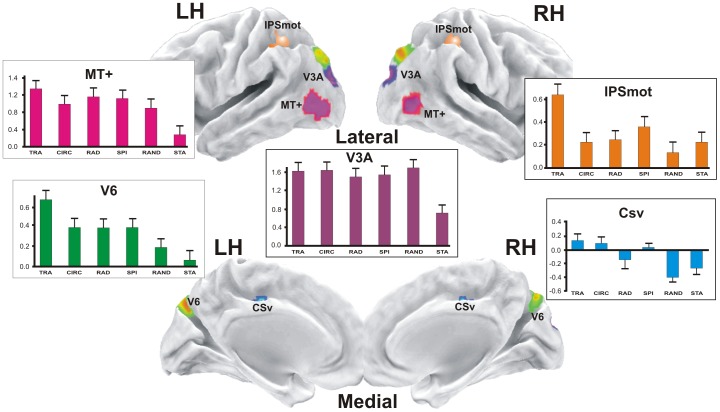
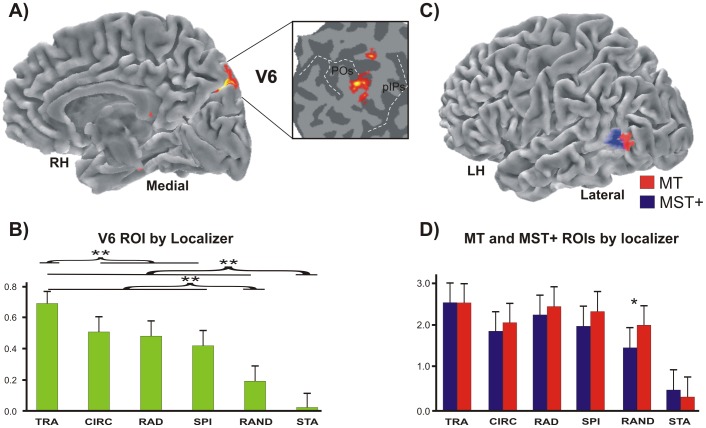
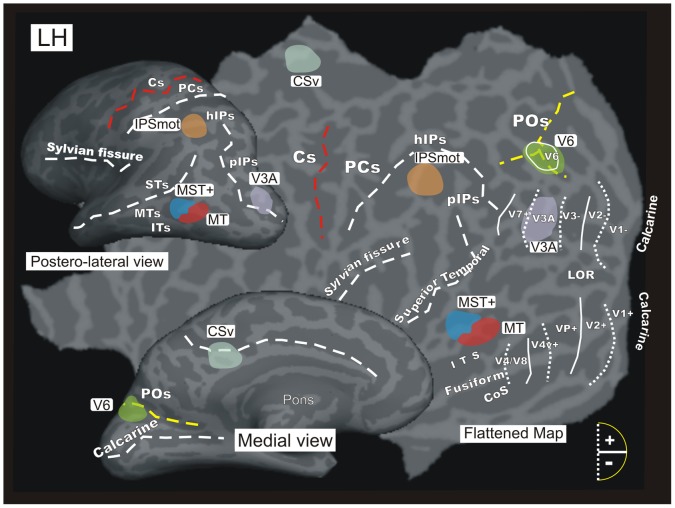
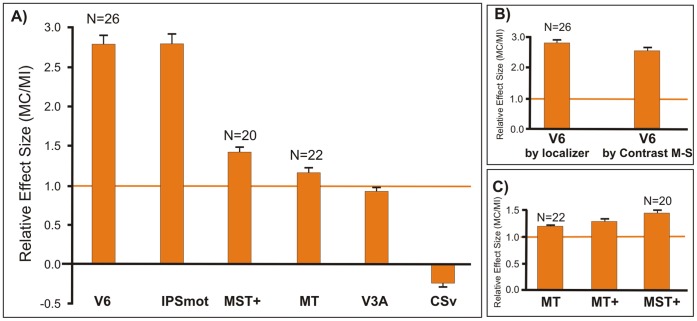
The optic flow generated when a person moves through the environment can be locally decomposed into several basic components, including radial, circular, translational and spiral motion. Since their analysis plays an important part in the visual perception and control of locomotion and posture it is likely that some brain regions in the primate dorsal visual pathway are specialized to distinguish among them. The aim of this study is to explore the sensitivity to different types of egomotion-compatible visual stimulations in the human motion-sensitive regions of the brain. Event-related fMRI experiments, 3D motion and wide-field stimulation, functional localizers and brain mapping methods were used to study the sensitivity of six distinct motion areas (V6, MT, MST+, V3A, CSv and an Intra-Parietal Sulcus motion [IPSmot] region) to different types of optic flow stimuli. Results show that only areas V6, MST+ and IPSmot are specialized in distinguishing among the various types of flow patterns, with a high response for the translational flow which was maximum in V6 and IPSmot and less marked in MST+. Given that during egomotion the translational optic flow conveys differential information about the near and far external objects, areas V6 and IPSmot likely process visual egomotion signals to extract information about the relative distance of objects with respect to the observer. Since area V6 is also involved in distinguishing object-motion from self-motion, it could provide information about location in space of moving and static objects during self-motion, particularly in a dynamically unstable environment.
Conflict of interest statement
Figures
Similar articles
-
A common neural substrate for processing scenes and egomotion-compatible visual motion.Brain Struct Funct. 2020 Sep;225(7):2091-2110. doi: 10.1007/s00429-020-02112-8. Epub 2020 Jul 9. Brain Struct Funct. 2020. PMID: 32647918 Free PMC article.
-
Neural substrates underlying the passive observation and active control of translational egomotion.J Neurosci. 2015 Mar 11;35(10):4258-67. doi: 10.1523/JNEUROSCI.2647-14.2015. J Neurosci. 2015. PMID: 25762672 Free PMC article.
-
Neural sensitivity to translational self- and object-motion velocities.Hum Brain Mapp. 2024 Jan;45(1):e26571. doi: 10.1002/hbm.26571. Hum Brain Mapp. 2024. PMID: 38224544 Free PMC article.
-
Human cortical areas underlying the perception of optic flow: brain imaging studies.Int Rev Neurobiol. 2000;44:269-92. doi: 10.1016/s0074-7742(08)60746-1. Int Rev Neurobiol. 2000. PMID: 10605650 Review.
-
The cortical visual area V6 in macaque and human brains.J Physiol Paris. 2009 Jan-Mar;103(1-2):88-97. doi: 10.1016/j.jphysparis.2009.05.012. Epub 2009 Jun 10. J Physiol Paris. 2009. PMID: 19523515 Review.
Cited by
-
Future challenges for vection research: definitions, functional significance, measures, and neural bases.Front Psychol. 2015 Feb 27;6:193. doi: 10.3389/fpsyg.2015.00193. eCollection 2015. Front Psychol. 2015. PMID: 25774143 Free PMC article. Review.
-
Effects of luminance contrast, averaged luminance and spatial frequency on vection.Exp Brain Res. 2021 Dec;239(12):3507-3525. doi: 10.1007/s00221-021-06214-5. Epub 2021 Sep 16. Exp Brain Res. 2021. PMID: 34529107
-
The human homologue of macaque area V6A.Neuroimage. 2013 Nov 15;82:517-30. doi: 10.1016/j.neuroimage.2013.06.026. Epub 2013 Jun 14. Neuroimage. 2013. PMID: 23770406 Free PMC article.
-
Detailed spatiotemporal brain mapping of chromatic vision combining high-resolution VEP with fMRI and retinotopy.Hum Brain Mapp. 2018 Jul;39(7):2868-2886. doi: 10.1002/hbm.24046. Epub 2018 Mar 13. Hum Brain Mapp. 2018. PMID: 29536594 Free PMC article.
-
Walking without optic flow reduces subsequent vection.Exp Brain Res. 2015 Jan;233(1):275-81. doi: 10.1007/s00221-014-4109-4. Epub 2014 Oct 2. Exp Brain Res. 2015. PMID: 25273923 Clinical Trial.
References
-
- Morrone MC, Tosetti M, Montanaro D, Fiorentini A, Cioni G, et al. (2000) A cortical area that responds specifically to optic flow, revealed by fMRI. Nature Neurosci 3: 1322–1328. - PubMed
-
- Kleinschmidt A, Thilo KV, Büchel C, Gresty MA, Bronstein AM, et al. (2002) Neural correlates of visual-motion perception as object- or self-motion. Neuroimage 16(4): 873–882. - PubMed
-
- Wall MB, Smith AT (2008) The Representation of Egomotion in the Human Brain. Curr Biol 18: 191–194. - PubMed
Publication types
MeSH terms
LinkOut - more resources
Full Text Sources
Other Literature Sources
