

Metabolomic analysis reveals metabolic disturbance in the cortex and hippocampus of subchronic MK-801 treated rats
- PMID: 23577129
- PMCID: PMC3618452
- DOI: 10.1371/journal.pone.0060598
Metabolomic analysis reveals metabolic disturbance in the cortex and hippocampus of subchronic MK-801 treated rats
Abstract
Background: Although a number of proteins and genes relevant to schizophrenia have been identified in recent years, few are known about the exact metabolic pathway involved in this disease. Our previous proteomic study has revealed the energy metabolism abnormality in subchronic MK-801 treated rat, a well-established animal model for schizophrenia. This prompted us to further investigate metabolite levels in the same rat model to better delineate the metabolism dysfunctions and provide insights into the pathology of schizophrenia.
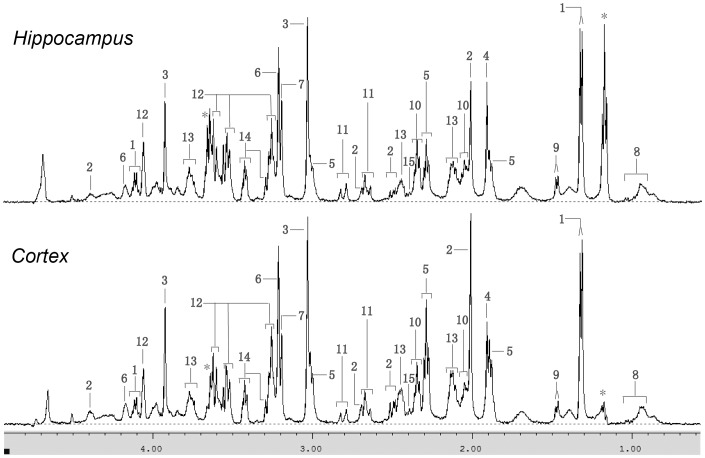
Methods: Metabolomics, a high-throughput investigatory strategy developed in recent years, can offer comprehensive metabolite-level insights that complement protein and genetic findings. In this study, we employed a nondestructive metabolomic approach (1H-MAS-NMR) to investigate the metabolic traits in cortex and hippocampus of MK-801 treated rats. Multivariate statistics and ingenuity pathways analyses (IPA) were applied in data processing. The result was further integrated with our previous proteomic findings by IPA analysis to obtain a systematic view on our observations.
Results: Clear distinctions between the MK-801 treated group and the control group in both cortex and hippocampus were found by OPLS-DA models (with R(2)X = 0.441, Q(2)Y = 0.413 and R(2)X = 0.698, Q(2)Y = 0.677, respectively). The change of a series of metabolites accounted for the separation, such as glutamate, glutamine, citrate and succinate. Most of these metabolites fell in a pathway characterized by down-regulated glutamate synthesis and disturbed Krebs cycle. IPA analysis further confirmed the involvement of energy metabolism abnormality induced by MK-801 treatment.
Conclusions: Our metabolomics findings reveal systematic changes in pathways of glutamate metabolism and Krebs cycle in the MK-801 treated rats' cortex and hippocampus, which confirmed and improved our previous proteomic observation and served as a valuable reference to the etiology research of schizophrenia.
Conflict of interest statement
Figures


References
-
- Knapp M, Mangalore R, Simon J (2004) The global costs of schizophrenia. Schizophr Bull 30: 279–293. - PubMed
-
- Rogers DP, Goldsmith CA (2009) Treatment of schizophrenia in the 21st Century: beyond the neurotransmitter hypothesis. Expert Rev Neurother 9: 47–54. - PubMed
-
- Vita A, Dieci M, Giobbio GM, Tenconi F, Invernizzi G (1997) Time course of cerebral ventricular enlargement in schizophrenia supports the hypothesis of its neurodevelopmental nature. Schizophr Res 23: 25–30. - PubMed
-
- Bubenikova-Valesova V, Horacek J, Vrajova M, Hoschl C (2008) Models of schizophrenia in humans and animals based on inhibition of NMDA receptors. Neurosci Biobehav Rev 32: 1014–1023. - PubMed
Publication types
MeSH terms
Substances
Grants and funding
LinkOut - more resources
Full Text Sources
Other Literature Sources
