. 2013 Apr 2:2:e00278.
doi: 10.7554/eLife.00278.

Stepwise assembly of the human replicative polymerase holoenzyme

Affiliations

Stepwise assembly of the human replicative polymerase holoenzyme

Mark Hedglin et al. Elife. .

Abstract

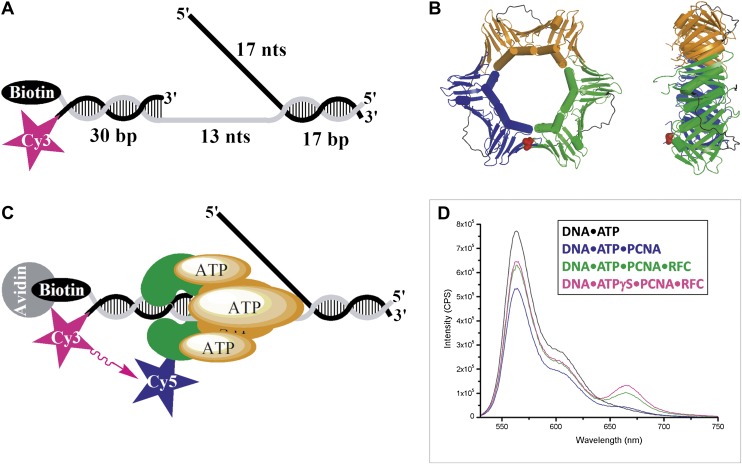
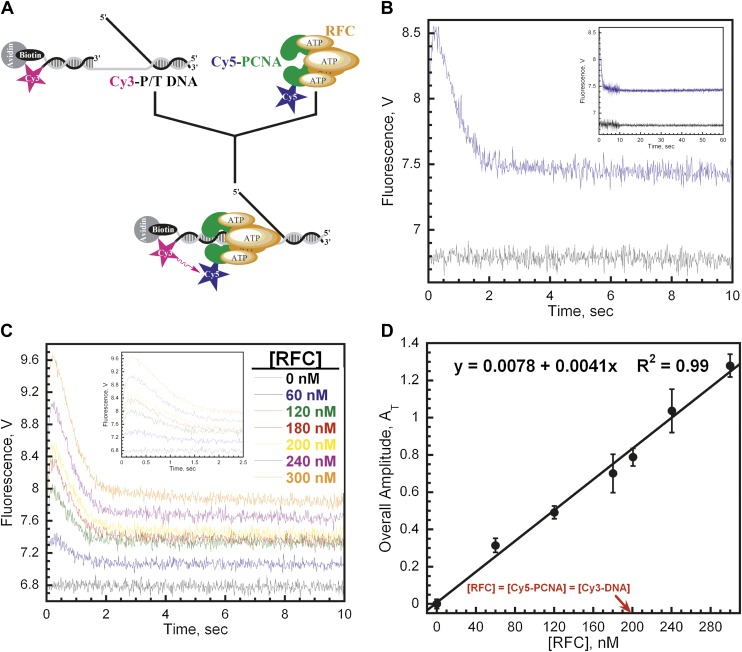
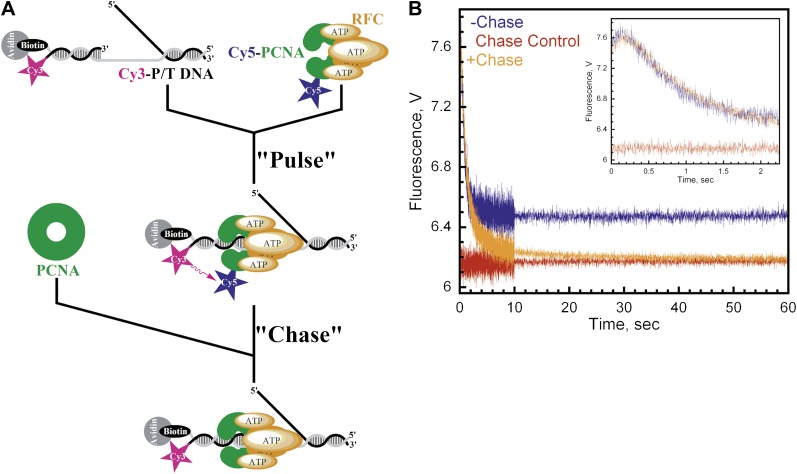
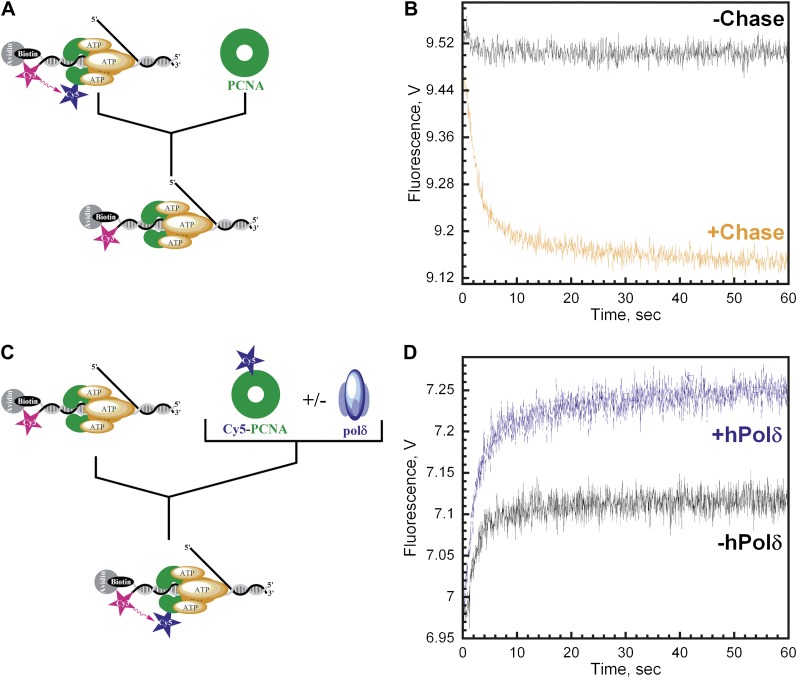
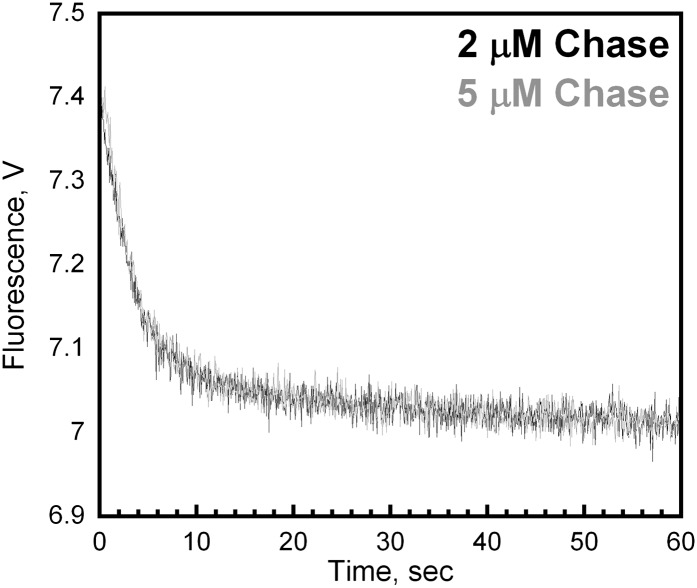
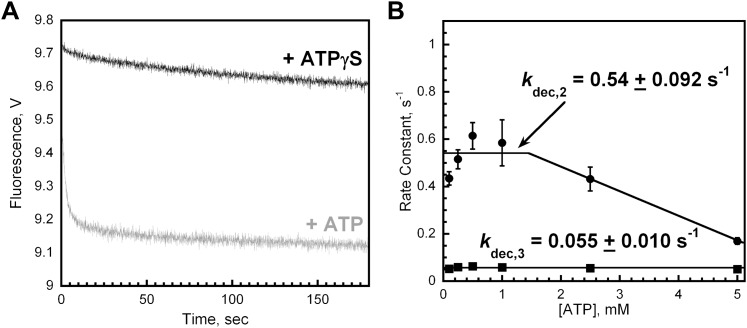
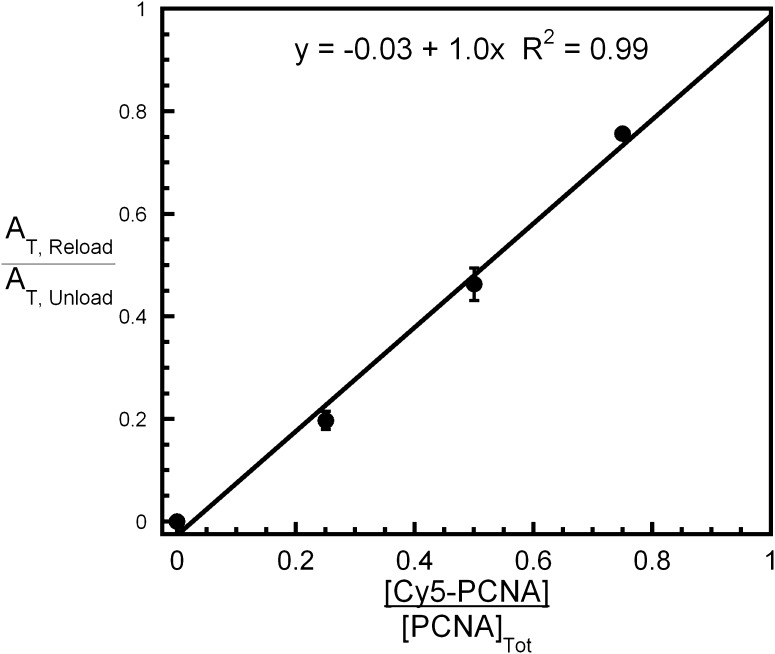
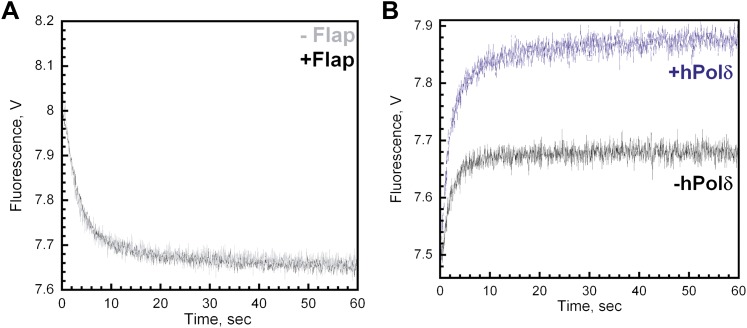
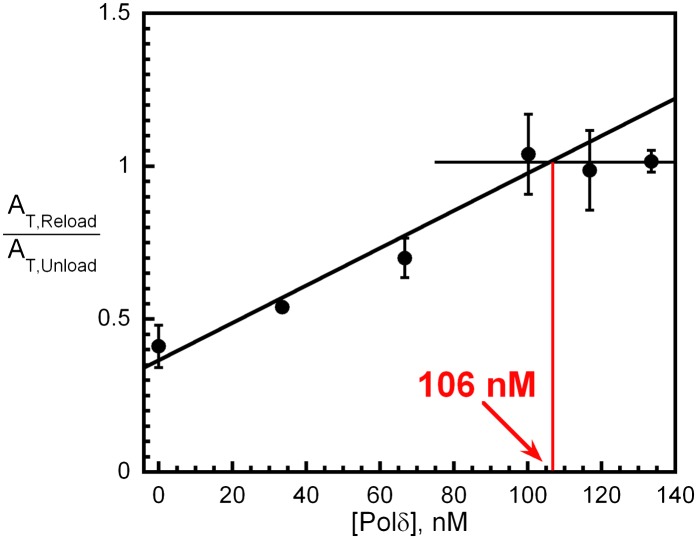
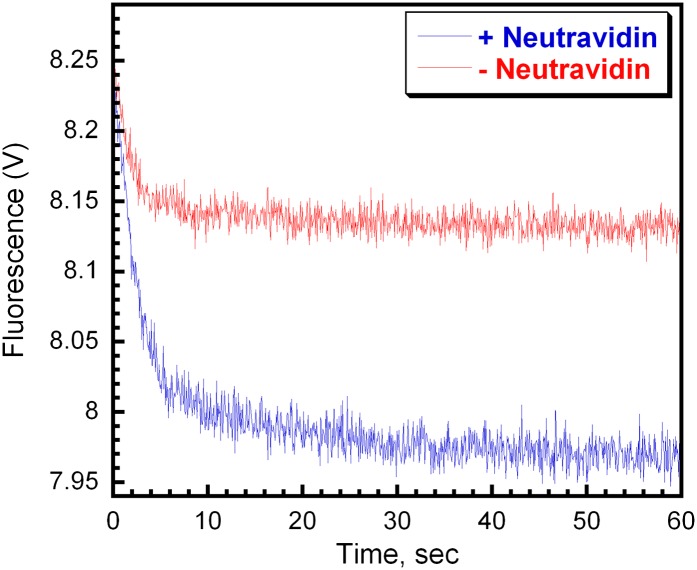
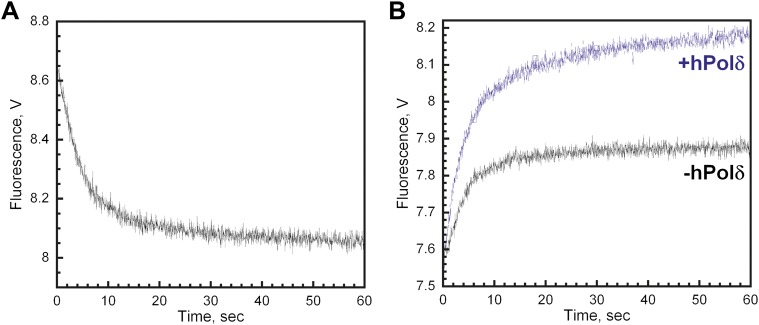
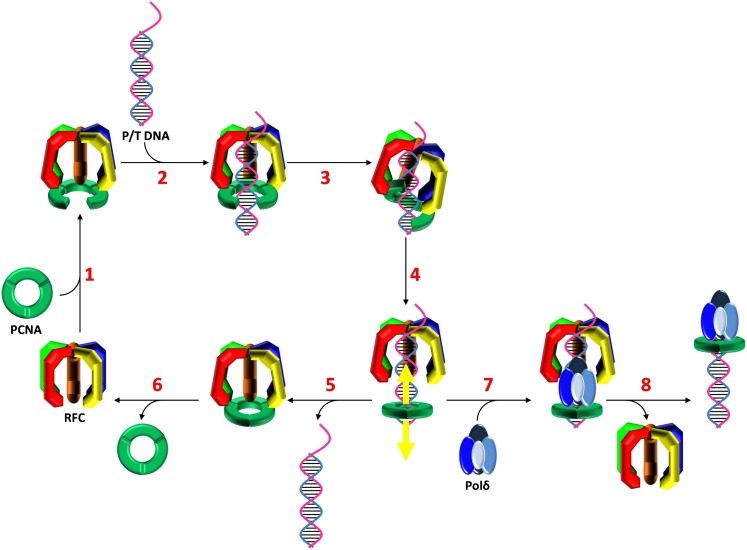
In most organisms, clamp loaders catalyze both the loading of sliding clamps onto DNA and their removal. How these opposing activities are regulated during assembly of the DNA polymerase holoenzyme remains unknown. By utilizing FRET to monitor protein-DNA interactions, we examined assembly of the human holoenzyme. The results indicate that assembly proceeds in a stepwise manner. The clamp loader (RFC) loads a sliding clamp (PCNA) onto a primer/template junction but remains transiently bound to the DNA. Unable to slide away, PCNA re-engages with RFC and is unloaded. In the presence of polymerase (polδ), loaded PCNA is captured from DNA-bound RFC which subsequently dissociates, leaving behind the holoenzyme. These studies suggest that the unloading activity of RFC maximizes the utilization of PCNA by inhibiting the build-up of free PCNA on DNA in the absence of polymerase and recycling limited PCNA to keep up with ongoing replication. DOI:http://dx.doi.org/10.7554/eLife.00278.001.

Keywords: DNA polymerase holoenzyme assembly; Human; clamp loader; clamp loading; clamp unloading; sliding clamp.


Conflict of interest statement

The authors declare that no competing interests exist.

Figures

Figure 1.
Figure 1.. RFC-mediated loading of PCNA onto DNA.
(A) Schematic representation of the Cy3-P/T DNA substrate used in this study. The primer had a Cy3 dye at the 5′ end and biotin was attached to the 3′ end of the template. Sequences for the primer, template, and flap constructs of all substrates used in this study are shown in Table 1. The recombinant human proteins used in this study are shown in Figure 1—figure supplement 1 .(B) Model of human PCNA generated using Pymol from PDB code 1AXC (Gulbis et al., 1996). PCNA subunits are shown in ribbon form in green, orange, and blue. The asparagine 107 residue, shown in red for one PCNA monomer in space-filling form, was mutated to cysteine for dye labeling. On average, each PCNA trimer has at least one labeled monomer. The mutations nor the labeling of PCNA had any effect on its ability to interact of RFC (Figure 1—figure supplement 2). Frontal and side views are shown. (C) Schematic representation of RFC-catalyzed loading of PCNA onto DNA. The N107C residue of PCNA is located on the face opposite that which interacts with RFC and faces the Cy3 FRET donor on the P/T DNA. (D) Fluorescence emission spectra obtained by exciting the Cy3-P/T DNA with a 514-nm light source. Cy5-PCNA can be excited through FRET from Cy3 only when the two dyes are in close proximity (<∼10 nm). Cy5 fluorescence intensity peaks at 665 nm. DOI: http://dx.doi.org/10.7554/eLife.00278.003
Figure 1—figure supplement 1.
Figure 1—figure supplement 1.. SDS–PAGE analysis of recombinant human proteins used in this study.
(Left) RFCp140ΔN555 (Lane 1, 12.5 pmol), wtPCNA (Lane 2, 25 pmol), mutPCNA (Lane 3, 25 pmol), Cy5-PCNA (Lane 4, 25 pmol), and polδ (Lane 5, 12.5 pmol) were loaded on a SDS 10% polyacrylamide gel and stained with Coomassie Blue. (Right) wtPCNA (Lane 1, 25 pmol), mutPCNA (Lane 2, 25 pmol), and Cy5-PCNA (Lanes 3–4, 25 pmol), were loaded on a SDS 10% polyacrylamide gel and imaged with UV trans illumination to visualize Cy5-label (Lane 4) prior to staining with Coomassie Blue. DOI: http://dx.doi.org/10.7554/eLife.00278.004
Figure 1—figure supplement 2.
Figure 1—figure supplement 2.. Activities of labeled PCNA mutants in stimulating human RFC ATPase activity.
The ATPase activity was determined at 25°C in an assay solution containing 125 nM RFC, 125 nM wtPCNA, mutPCNA, or Cy5PCNA, 125 nM P/T DNA (500 nM Neutravidin), 1 mM ATP, 3 mM phosphoenolpyruvate, 200 mM NADH, and 6–8 units of phosphoenolpyruvate kinase-lactate dehydrogenase mix. For each condition, the initial rates of ATP hydrolysis are reported as an average of three independent experiments ±SEM. DOI: http://dx.doi.org/10.7554/eLife.00278.005
Figure 2.
Figure 2.. RFC loads PCNA with rates independent of RFC concentration.
(A) Schematic representation of experimental procedure for Figure 2B. (B) Cy5-PCNA (200 nM) was incubated with RFC (200 nM) in the presence of 1 mM ATP. This preformed RFC•Cy5-PCNA•ATP complex was mixed with Cy3-P/T DNA (200 nM) in a stopped-flow instrument and the FRET signal was followed (Blue trace). The loading traces were fit to a double-exponential equation. If RFC was omitted, no FRET signal was observed (Black trace). An extended time course of 60 s is shown in the inset. (C) The experiments depicted in Figure 2A were also performed with varying concentrations of either RFC (0–300 nM) or ATP (0–5 mM). Shown in panel C is the RFC titration of the FRET signal. The initial 2.5 s of the FRET traces is shown in the inset. The loading traces were fit to double-exponential equations and the respective rate constants for the fitted FRET increases and decreases are presented as a function of [RFC] in Figure 2—figure supplement 1. The ATP titration of the FRET signal is presented in Figure 2—figure supplement 2. (D) The overall amplitude of the signal (sum of all amplitudes) from Figure 2C plotted against [RFC]. DOI: http://dx.doi.org/10.7554/eLife.00278.007
Figure 2—figure supplement 1.
Figure 2—figure supplement 1.. RFC loads PCNA with rates independent of RFC concentration.
The respective rate constants of the fitted FRET increase (kinc) and decrease (kdec,1) from Figure 2C as a function of [RFC]. DOI: http://dx.doi.org/10.7554/eLife.00278.008
Figure 2—figure supplement 2.
Figure 2—figure supplement 2.. RFC-catalyzed loading of PCNA is dependent upon ATP.
(A) and (B) Experiments were performed as depicted in Figure 2A with varying concentrations of ATP (0–5 mM). Loading traces were fit to double-exponential equations and the rate constants for the fitted FRET increase, kinc (shown in panel A), and FRET decrease, kdec,1 (shown in panel B), were plotted against [ATP]. In the absence of ATP, no FRET signal was observed (data not shown). (C) Experiments were performed as depicted in Figure 2A in the presence of 1 mM ATPγS. The loading traces (black) were overlaid on corresponding traces from Figure 2B performed at 1 mM ATP (grey). The loading traces were fit to a double-exponential equation with rate constants of 0.16 ± 1.3 × 10⁻² s−1 and 1.1 × 10⁻² ± 6.2 × 10⁻⁴ s−1 for the fitted fast and slow phases. DOI: http://dx.doi.org/10.7554/eLife.00278.009
Figure 3.
Figure 3.. Monitoring a single binding encounter between PCNA and P/T DNA.
(A) Schematic representation of pulse-chase experiment for Figure 3B. (B) Cy5-labeled PCNA (100 nM) was incubated with RFC (100 nM) and ATP (1 mM). This preformed RFC•Cy5-PCNA•ATP complex was mixed with Cy3-P/T DNA (100 nM) for 37 ± 2.9 ms (Pulse) prior to mixing with unlabeled PCNA at 0 or 2 μM concentration (Chase) in a stopped-flow instrument and the FRET signal was followed. In the absence of chase (‘−Chase,' blue trace), the traces appear biphasic as in Figure 2. In the presence of chase (‘+Chase,' orange trace), two additional phases appear in the FRET decrease. No FRET signal appears if unlabeled trap PCNA (2 μM) is added prior to Cy5-PCNA (‘Chase Control,' red trace). The initial 2.25 s of the FRET traces are shown in inset. DOI: http://dx.doi.org/10.7554/eLife.00278.010
Figure 4.
Figure 4.. polδ inhibits RFC-catalyzed unloading of PCNA to form the holoenzyme.
(A) Schematic representation of experimental procedure for Figure 4B. (B) Cy5-labeled PCNA (100 nM) loaded onto DNA (200 nM) by RFC (100 nM) in the presence of 1 mM ATP was mixed with 0 (−Chase, black trace) or 2 µM unlabeled PCNA chase (+Chase, orange trace) and the FRET signal was followed. The unloading traces were fit to a double-exponential equation and the rate constants and their relative amplitudes are reported in Table 2. These rate constants, along with their relative amplitudes, are independent of the unlabeled PCNA chase concentration (Figure 4—figure supplement 1). Only the faster of the two rate phases is dependent upon the concentration of ATP (Figure 4—figure supplement 2B). (C) Schematic representation of experimental procedure for Figure 4D. (D) Unlabeled PCNA (100 nM) loaded onto Cy3-P/T DNA (200 nM) by RFC (100 nM) in the presence of 1 mM ATP was mixed with Cy5- PCNA (100 nM) in the absence (black trace) or presence of polδ (blue trace) and the FRET signal was followed. The loading traces were fit to a double-exponential equation and the rate constants and their relative amplitudes are reported in Table 3. These experiments were also carried out with either varying concentrations of Cy5-PCNA in the absence of polδ (Figure 4—figure supplement 3) or with varying concentrations of polδ at a constant [Cy5-PCNA] (Figure 4—figure supplement 5). DOI: http://dx.doi.org/10.7554/eLife.00278.011
Figure 4—figure supplement 1.
Figure 4—figure supplement 1.. Unlabeled PCNA serves as a passive trap.
(A) Experiments were performed as depicted in Figure 4A with unlabeled PCNA trap at a concentration of either 2 (black trace) or 5 μM (grey trace). Representative loading traces were overlaid for comparison. At 2 μM trap concentration, the FRET signal decreases with biphasic behavior with rate constants of 0.32 ± 0.022 s−1 for the fast phase and 0.026 ± 0.014 s−1 for the slow phase with amplitudes of 0.35 ± 0.013 (81 ± 1.9%) and 0.080 ± 0.013 (19 ± 19%), respectively. At 5 μM trap concentration, the FRET signal decreases with biphasic behavior with rate constants of 0.35 ± 0.030 s−1 for the fast phase and 0.029 ± 0.010 s−1 for the slow phase with amplitudes of 0.39 ± 0.0010 (82 ± 0.90%) and 0.084 ± 0.0053 (18 ± 3.1%), respectively. DOI: http://dx.doi.org/10.7554/eLife.00278.012
Figure 4—figure supplement 2.
Figure 4—figure supplement 2.. Unloading of PCNA by RFC is dependent upon ATP.
(A) Experiments were carried out as depicted in Figure 4A in the presence of 1 mM ATPγS. The unloading trace (black) fits to a single exponential equation with rate constant of 6.2 × 10⁻³ ± 3.2 × 10⁻³ s−1. The unloading trace is overlaid on corresponding trace in presence of 1 mM ATP from Figure 4B (grey trace) for comparison. (B) Experiments were carried out as depicted in Figure 4A in the presence of varying concentrations of ATP (0–5 mM). The unloading traces were fit to double-exponential equations and the rate constants were plotted versus ATP concentration. DOI: http://dx.doi.org/10.7554/eLife.00278.013
Figure 4—figure supplement 3.
Figure 4—figure supplement 3.. All PCNA loaded onto P/T DNA dissociates with RFC.
Experiments carried out as depicted in Figure 4C with various concentrations of Cy5-PCNA (33, 100, or 300 nM). For each [Cy5-PCNA], the overall amplitude of the signal (AT,Reload) was divided by the overall amplitude for PCNA unloading (AT,Unload) determined in Figure 4B. Results were plotted against the fraction of Cy5-PCNA and fit to a linear regression. Each data point represents the average ± SEM of at least two independent experiments. DOI: http://dx.doi.org/10.7554/eLife.00278.014
Figure 4—figure supplement 4.
Figure 4—figure supplement 4.. The single-stranded DNA flap has no effect on the dissociation of RFC or PCNA from Cy3-P/T DNA.
(A) Experiments carried out as depicted in Figure 4A on the Cy3-P/T DNA substrate containing (‘+Flap,' black trace) or lacking (‘−Flap,' grey trace) the 17 nt single-stranded DNA flap. Representative traces were overlaid for comparison. All traces were fit to double-exponential equations and the rate constants and relative amplitudes for the fitted fast (kdec,2) and slow (kdec,3) are reported in Table 1 in the main text. When the flap was present, the FRET signal decreased with biphasic behavior with amplitudes of 0.32 ± 0.0055 for the fast phase and 0.067 ± 0.0038 for the slow phase (AT = 0.39 ± 0.0049). When the flap was removed, the FRET signal decreased with biphasic behavior with amplitudes of 0.34 ± 0.0076 for the fast phase and 0.068 ± 0.0021 for the slow phase (AT = 0.41 ± 0.0024). (B) All experiments were carried out as depicted in Figure 4C in the absence (black trace) or presence (blue trace) of polδ on a Cy3-labeled P/T DNA substrate lacking the single-stranded DNA flap. FRET traces were fit to double exponential equations and the calculated rate constants and relative amplitudes for the fitted fast (k1) and slow (k2) phases as well as AT,Reload/AT,Unload are reported in Table 2 in the main text. DOI: http://dx.doi.org/10.7554/eLife.00278.015
Figure 4—figure supplement 5.
Figure 4—figure supplement 5.. polδ captures a stoichiometric amount of loaded PCNA from DNA-bound RFC to form the holoenzyme.
Experiments carried out as depicted in Figure 4C with various concentrations of polδ (0–133 nM). For each [polδ], overall amplitude of the signal (AT,Reload) was divided by the overall amplitude for PCNA unloading (AT,Unload) determined in Figure 4B. Results were plotted against [polδ] and showed saturation at a concentration equivalent to the concentrations of RFC (100 nM) and PCNA (100 nM) used in the reaction. The rate constants for each phase as well as their relative amplitudes are independent of polδ concentration (Figure 4—figure supplement 6). DOI: http://dx.doi.org/10.7554/eLife.00278.016
Figure 4—figure supplement 6.
Figure 4—figure supplement 6.. polδ passively captures loaded PCNA from DNA-bound RFC to form the holoenzyme and RFC dissociates from P/T DNA independently of polδ and PCNA.
polδ passively captures loaded PCNA from DNA-bound RFC to form the holoenzyme and RFC dissociates from P/T DNA independently of polδ and PCNA. The respective rate constants (A) and relative amplitudes (B) of the fitted fast (k1) and slow (k2) phases from Figure 4—figure supplement 5 as a function of [polδ]. Each data point represents the average ±SEM of at least two independent measurements. DOI: http://dx.doi.org/10.7554/eLife.00278.017
Figure 4—figure supplement 7.
Figure 4—figure supplement 7.. RFC releases PCNA onto P/T DNA.
(A) Experiment performed as depicted in Figure 4A in the presence (blue trace) or absence (red trace) of Neutravidin. Representative unloading traces were overlaid for comparison. In the presence of Neutravidin, the FRET signal decreases with biphasic behavior with rate constants of 0.44 ± 0.033 s−1 for the fast phase and 0.042 ± 0.010 s−1 for the slow phase with amplitudes of 0.24 ± 0.024 (83 ± 0.97%) and 0.051± 0.0067 (17 ± 0.97%), respectively. In the presence of Neutravidin, the FRET signal decreases with biphasic behavior with rate constants of 0.65 ± 0.054 s−1 for the fast phase and 0.051 ± 0.015 s−1 for the slow phase with amplitudes of 0.11 ± 0.011 (85 ± 2.9%) and 0.018 ± 0.0031 (15 ± 2.9%), respectively. DOI: http://dx.doi.org/10.7554/eLife.00278.018
Figure 4—figure supplement 8.
Figure 4—figure supplement 8.. Removing 5 bp from the double-stranded region of the P/T junction has no effect on RFC-catalyzed unloading of PCNA from Cy3-P/T DNA or formation of the polδ holoenzyme.
Removing 5 bp from the double-stranded region of the P/T junction has no effect on RFC-catalyzed unloading of PCNA from Cy3-P/T DNA or formation of the polδ holoenzyme. All experiments were performed on a Cy3-P/T DNA substrate in which 5 bp within the double-stranded region of the P/T junction was removed (Cy3-P/T DNA-25 bp). (A) Experiments were carried out as depicted in Figure 4A. All FRET traces were fit to double-exponential equations and the rate constants and relative amplitudes for the fitted fast (kdec,2) and slow (kdec,3) are reported in Table 1 in the main text. (B) Experiments were carried out as depicted in Figure 4C in the absence (black trace) or presence (blue trace) of polδ. All FRET traces were fit to double exponential equations and the calculated rate constants and relative amplitudes for the fitted fast (k1) and slow (k2) phases as well AT,Reload/AT,Unload are reported in Table 2 in the main text. DOI: http://dx.doi.org/10.7554/eLife.00278.019
Figure 5.
Figure 5.. Stepwise assembly of the human DNA polymerase holoenzyme.
(1) RFC•ATP binds PCNA and opens it for assembly onto DNA. (2) The open PCNA•RFC•ATP complex binds to a P/T junction and (3) adopts the notched screw cap arrangement. (4) RFC hydrolyzes ATP, closing the PCNA ring and releasing it onto DNA. (5) In the absence of polymerase, loaded PCNA is unable to ‘escape' from DNA-bound RFC and is unloaded back into solution by RFC. (6) RFC subsequently releases PCNA, exchanges ADP for ATP, and the cycle repeats. (7) In the presence of polymerase, loaded PCNA is ‘captured' from DNA-bound RFC by an incoming polymerase, blocking the unloading activity of DNA-bound RFC by physical occlusion. (8) RFC subsequently dissociates, leaving behind the functional holoenzyme consisting of polymerase and PCNA. DOI: http://dx.doi.org/10.7554/eLife.00278.022
Figure 5—figure supplement 1.
Figure 5—figure supplement 1.. The human notched screw cap complex.
The DNA footprint of the human RFC•ATPγS•PCNA complex (Tsurimoto and Stillman, 1991) overlaid on the Cy3-P/T DNA substrate. Shown in magenta is the region protected by human RFC. Shown in cyan is the region protected by human PCNA. DOI: http://dx.doi.org/10.7554/eLife.00278.023
Figure 5—figure supplement 2.
Figure 5—figure supplement 2.. The clamp loader gp44/62 of T4 bacteriophage retracts towards the P/T junction upon hydrolysis of ATP and closure of the gp45 clamp ring around DNA.
The open clamp:clamp loader:DNA complex (PDB code 3U60) and the closed clamp:clamp loader:DNA complex (PDB code 3U61) are shown in the same orientation (via alignment of the AAA+ module of the C subunit). Images were generated using Pymol. P/T DNA and gp45 (gray) are shown in cartoon form. The surface of gp44/62 (multicolored) is shown. The clamp loader subunits (A–E), gp45 as well as the primer (orange) and template (yellow) strands of the duplex DNA are indicated. DOI: http://dx.doi.org/10.7554/eLife.00278.024

References

    1. Berg OG, von Hippel PH. 1985. Diffusion-controlled macromolecular interactions. Annu Rev Biophys Biophys Chem 14:131–60 doi: 10.1146/annurev.bb.14.060185.001023 - DOI - PubMed
    1. Bowman GD, O'Donnell M, Kuriyan J. 2004. Structural analysis of a eukaryotic sliding DNA clamp-clamp loader complex. Nature 429:724–30 doi: 10.1038/nature02585 - DOI - PubMed
    1. Burgers PM. 2009. Polymerase dynamics at the eukaryotic DNA replication fork. J Biol Chem 284:4041–5 doi: 10.1074/jbc.R800062200 - DOI - PMC - PubMed
    1. Cai J, Gibbs E, Uhlmann F, Phillips B, Yao N, O'Donnell M, et al. 1997. A complex consisting of human replication factor C p40, p37, and p36 subunits is a DNA-dependent ATPase and an intermediate in the assembly of the holoenzyme. J Biol Chem 272:18974–81 doi: 10.1074/jbc.272.30.18974 - DOI - PubMed
    1. Cai J, Uhlmann F, Gibbs E, Flores-Rozas H, Lee CG, Phillips B, et al. 1996. Reconstitution of human replication factor C from its five subunits in baculovirus-infected insect cells. Proc Natl Acad Sci USA 93:12896–901 doi: 10.1073/pnas.93.23.12896 - DOI - PMC - PubMed