. 2013 Apr 1;4(4):619-34.
doi: 10.1364/BOE.4.000619. Epub 2013 Mar 28.

Joint aperture detection for speckle reduction and increased collection efficiency in ophthalmic MHz OCT

Affiliations

Joint aperture detection for speckle reduction and increased collection efficiency in ophthalmic MHz OCT

Thomas Klein et al. Biomed Opt Express. .

Abstract

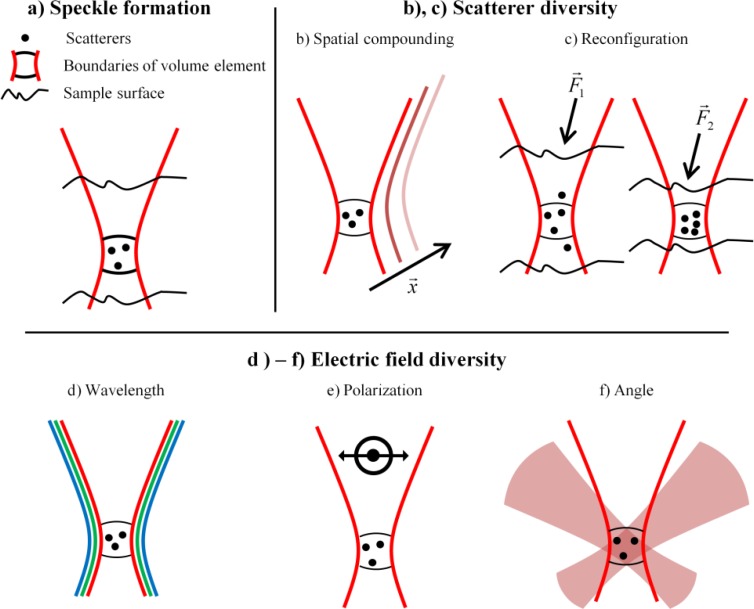
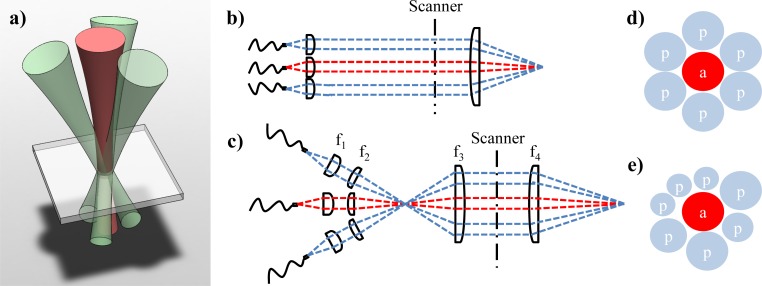
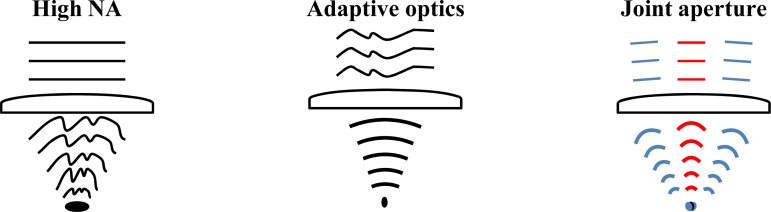
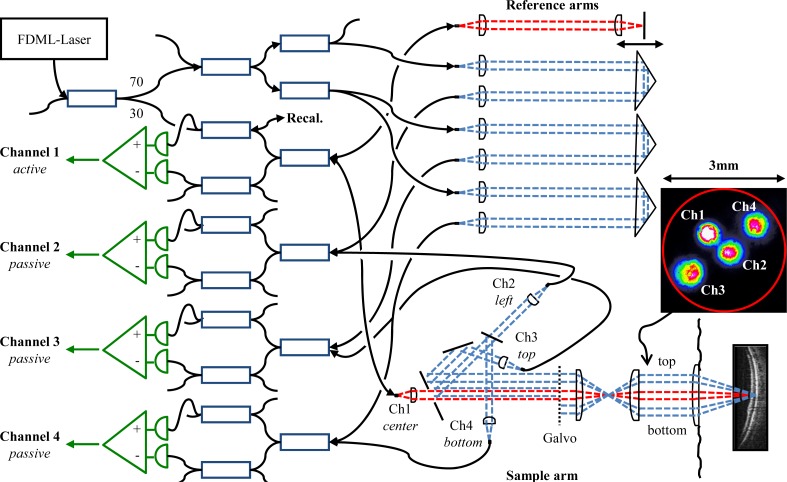
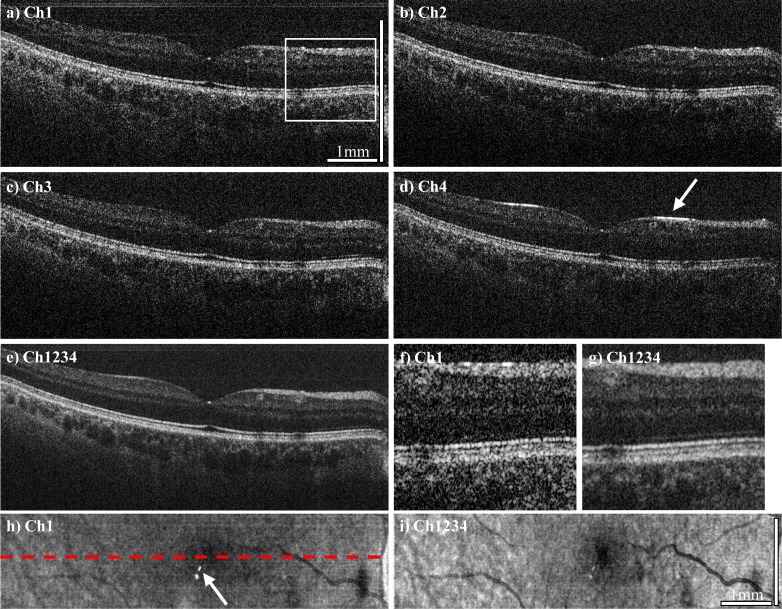
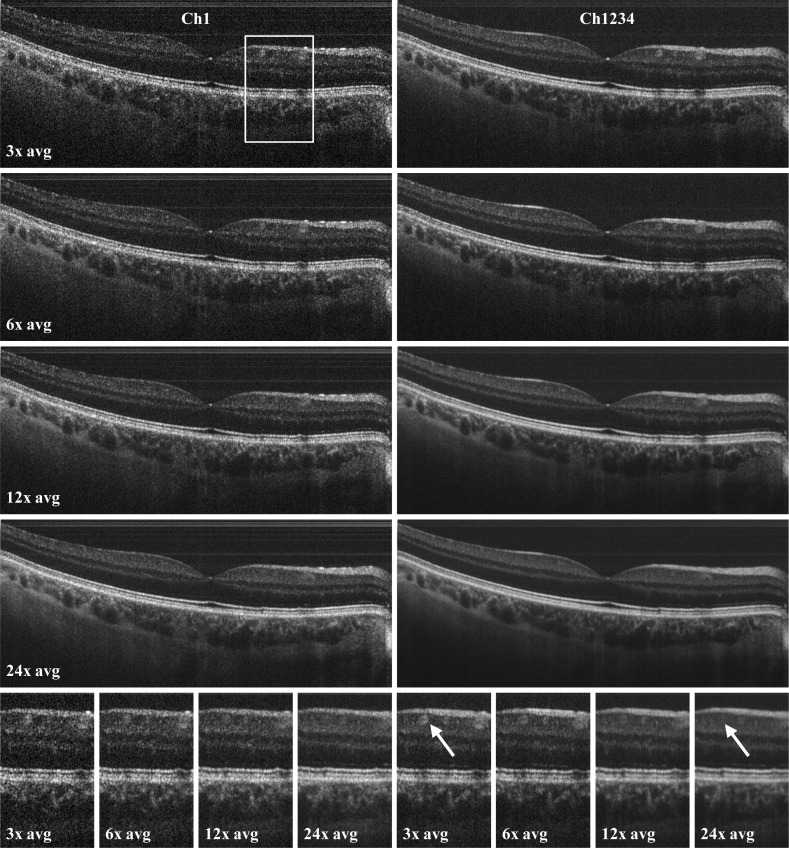
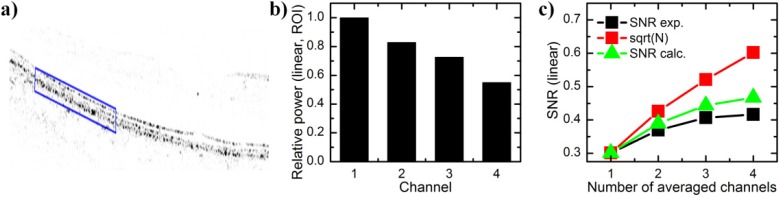
Joint-aperture optical coherence tomography (JA-OCT) is an angle-resolved OCT method, in which illumination from an active channel is simultaneously probed by several passive channels. JA-OCT increases the collection efficiency and effective sensitivity of the OCT system without increasing the power on the sample. Additionally, JA-OCT provides angular scattering information about the sample in a single acquisition, so the OCT imaging speed is not reduced. Thus, JA-OCT is especially suitable for ultra high speed in-vivo imaging. JA-OCT is compared to other angle-resolved techniques, and the relation between joint aperture imaging, adaptive optics, coherent and incoherent compounding is discussed. We present angle-resolved imaging of the human retina at an axial scan rate of 1.68 MHz, and demonstrate the benefits of JA-OCT: Speckle reduction, signal increase and suppression of specular and parasitic reflections. Moreover, in the future JA-OCT may allow for the reconstruction of the full Doppler vector and tissue discrimination by analysis of the angular scattering dependence.

Keywords: (030.6140) Speckle; (120.3890) Medical optics instrumentation; (170.3880) Medical and biological imaging; (170.4500) Optical coherence tomography.


Figures

Fig. 1
Fig. 1
a) Speckle is formed by superposition of the electric fields from scatterers in each resolvable volume element. b)-f) Speckle reduction: b) In spatial techniques, speckle patterns from different locations are compounded, yielding speckle reduction at the cost of reduced (transverse) resolution. c) Scatterer diversity may also be achieved by induced motion of the scatterers. d) Wavelength diversity employs incoherent compounding of the speckle pattern formed at different wavelengths. e) Polarization diversity can also achieve speckle reduction. f) Since the speckle pattern looks different from every angle, speckle can be reduced by angular compounding. JA-OCT uses this angle-anisotropy to combine active illumination with passive probe channels.
Fig. 2
Fig. 2
In joint aperture OCT (JA-OCT), the sample is illuminated by one active beam and additionally probed by passive beams. a) Rendering of a symmetric JA-OCT geometry with active center beam and three probe beams. b,c) Schematic sample arm configurations for JA-OCT. An intermediate focus may allow for more flexible beam alignment, since the lenses may have a larger distance between each other. d) If all beams have the same size, dense packing allows for a maximum of 6 probe beams surrounding the active beam. e) However, JA-OCT is neither restricted to a symmetric configuration nor to beams of the same size. a: active (illuminating) beam; p: passive (probe-only) beam.
Fig. 3
Fig. 3
Comparison of standard high numerical aperture (NA), adaptive optics (AO) and joint aperture (JA) confocal imaging. In each case, the figure shows the incoming wavefront, a focusing lens, and the converging wavefront to one sample location. In high NA imaging, lens aberrations induce more and more wavefront distortion as NA is increased. Thus, the imaging system reaches maximum collection efficiency at an NA value that is given by the specific imaging system. With adaptive optics, the incoming wavefront is predistorted in order to compensate for aberrations, enabling the use of very large NAs. JA imaging is conceptually similar to AO imaging, since each beam can easily be tilted individually in order to correct for aberrations. Note that, contrary to high-NA and AO methods, the relative phase across the NA does not need to be actively controlled, since it is already set by the active (illuminating) beam.
Fig. 4
Fig. 4
JA-OCT interferometer layout. Square boxes represent 3dB fiber couplers, unless the coupling ratio is indicated individually. Fiber based polarization controllers are present in each sample and reference arm (not shown). Note that the direction of view in the sample arm is switched from top view to side view at the galvanometer mirrors in order to better visualize the beam geometry. Inset: Beam profile in front of the eye, with light coupled to all channels. All beams are located in a circular aperture (red) of 3mm diameter.
Fig. 5
Fig. 5
a-d) OCT B-frame tomograms from channel 1 to 4, consisting of 2112 axial scans, acquired at 1.68 MHz axial scan rate. e) Compounded tomogram (average of all channels), exhibiting improved image quality. f,g) Zoomed region of interest (ROI) of channel 1 and the compound tomogram, at the position indicated by the white box in a). Speckle reduction in the compounded image is clearly visible. Also note the increased visibility of the retinal layers, for instance of the external limiting membrane (ELM). Reflection from the ELM seems to be angle-dependent, with most of the signal in this region stemming from channel 3. h,i) En-face views of the complete data set (256 frames), indicating the position of the B-frames with the dashed red line. JA-OCT clearly reduces the impact of both specular reflections from the sample (see arrow in Ch4) and of parasitic reflections, which originate from the sample arm lenses (see arrow in the en-face view of Ch1). Scale bar length is 1mm in tissue (assuming n = 1.33, 0.288 mm/degree scan angle).
Fig. 6
Fig. 6
Averaging of adjacent frames in standard single-channel OCT (left) and JA-OCT (right), at the same location as in Fig. 5. Image quality of the compounded JA-OCT images is always superior to single-channel imaging. Bottom: In the enlarged image sections, it can be clearly seen that averaging of frames spanning less than 100 µm distance already blurs out important image detail, such as the blood vessel indicated by the arrow.
Fig. 7
Fig. 7
a) Retinal image with inverse contrast and in linear power scale (FFT signal squared). Blue box indicated region of interest (ROI) around the RPE layer. b) Mean signal power in the ROI with respect to the power in the active channel 1. c) Signal-to-noise ratio (SNR) calculated as power mean to power standard deviation over the entire image (black squares). Since the signal is weaker in the passive channels, the SNR increase is lower than with the square root of channel number (black squares). The experimental SNR increase is close to the calculated value (green triangles), which takes into account the varying power levels, assuming completely uncorrelated speckle patterns (Eq. (1)).

References

    1. Huang D., Swanson E. A., Lin C. P., Schuman J. S., Stinson W. G., Chang W., Hee M. R., Flotte T., Gregory K., Puliafito C. A., Fujimoto J. G., “Optical coherence tomography,” Science 254(5035), 1178–1181 (1991).10.1126/science.1957169 - DOI - PMC - PubMed
    1. Swanson E. A., Izatt J. A., Hee M. R., Huang D., Lin C. P., Schuman J. S., Puliafito C. A., Fujimoto J. G., “In vivo retinal imaging by optical coherence tomography,” Opt. Lett. 18(21), 1864–1866 (1993).10.1364/OL.18.001864 - DOI - PubMed
    1. Fercher A. F., Hitzenberger C. K., Drexler W., Kamp G., Sattmann H., “In vivo optical coherence tomography,” Am. J. Ophthalmol. 116(1), 113–114 (1993). - PubMed
    1. Puliafito C. A., Hee M. R., Lin C. P., Reichel E., Schuman J. S., Duker J. S., Izatt J. A., Swanson E. A., Fujimoto J. G., “Imaging of macular diseases with optical coherence tomography,” Ophthalmology 102(2), 217–229 (1995). - PubMed
    1. Drexler W., Fujimoto J. G., “State-of-the-art retinal optical coherence tomography,” Prog. Retin. Eye Res. 27(1), 45–88 (2008).10.1016/j.preteyeres.2007.07.005 - DOI - PubMed