

Differential scanning calorimetric evaluation of human meibomian gland secretions and model lipid mixtures: transition temperatures and cooperativity of melting
- PMID: 23578711
- PMCID: PMC3786407
- DOI: 10.1016/j.chemphyslip.2013.03.005
Differential scanning calorimetric evaluation of human meibomian gland secretions and model lipid mixtures: transition temperatures and cooperativity of melting
Abstract
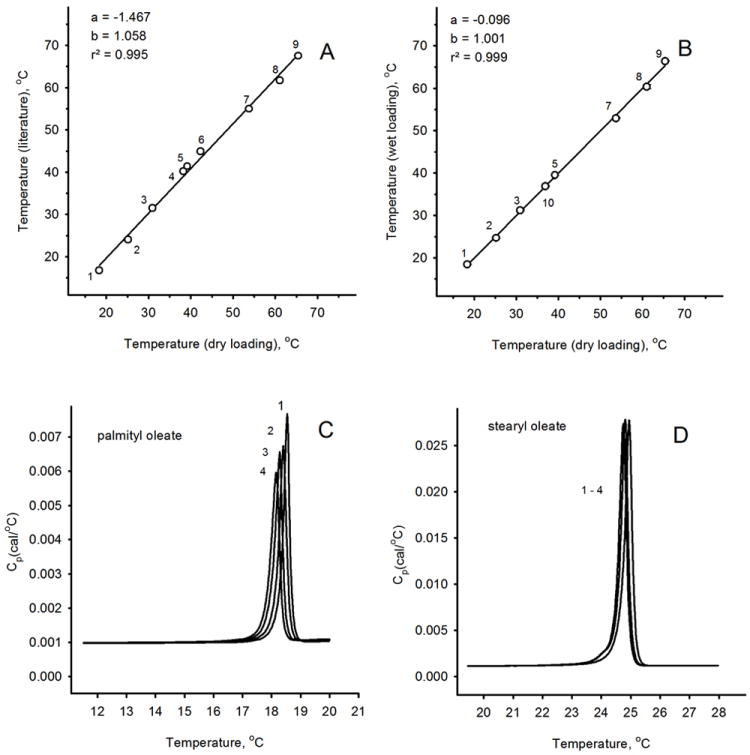
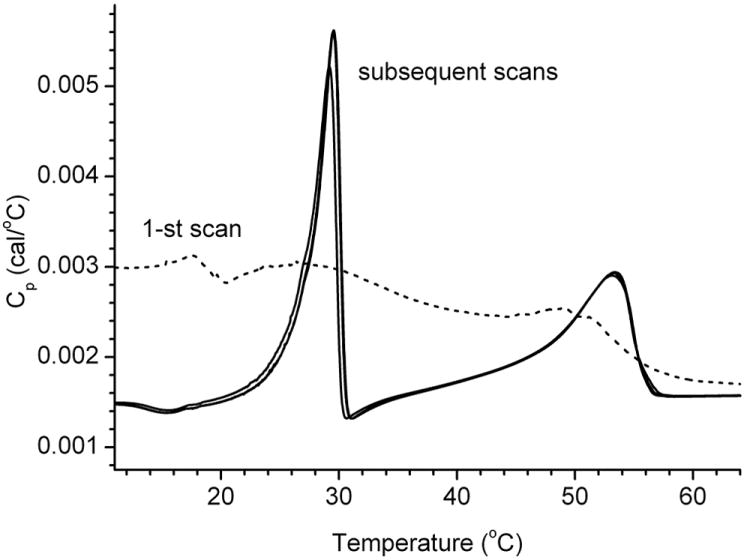
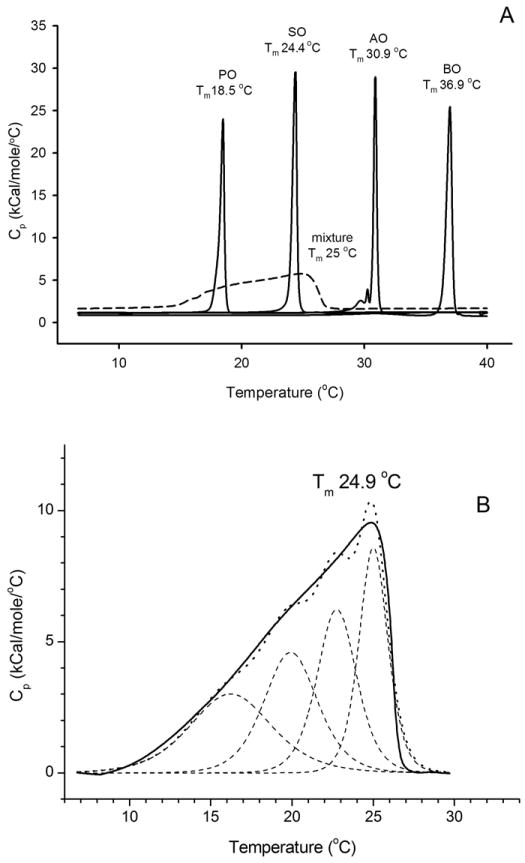
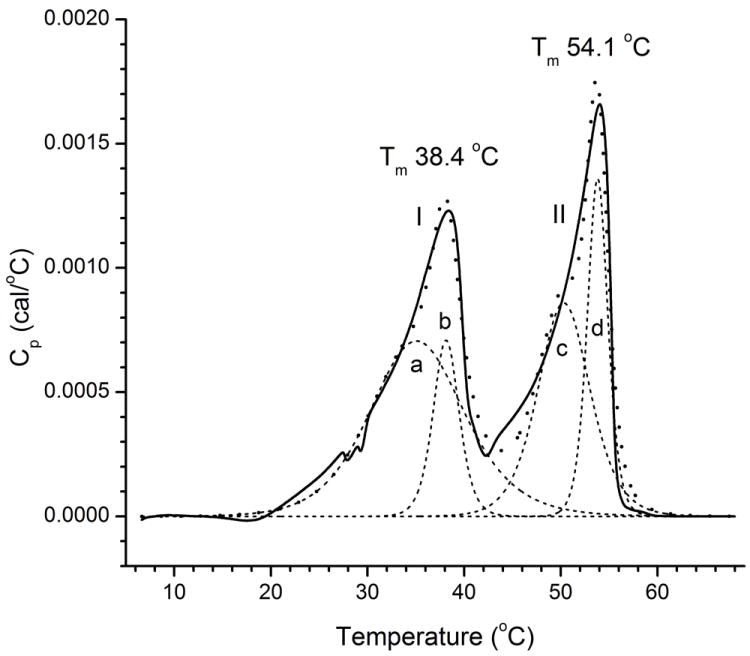
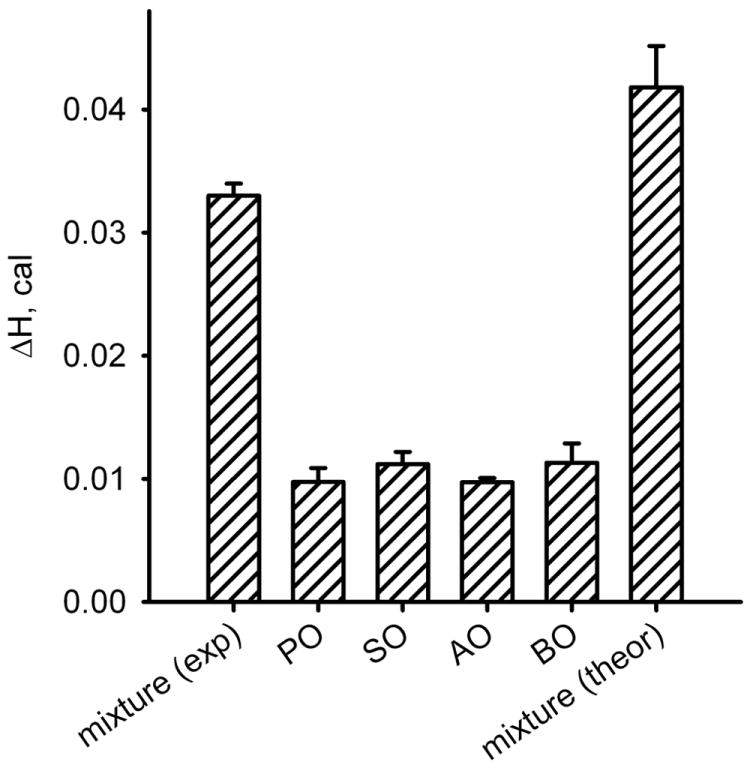
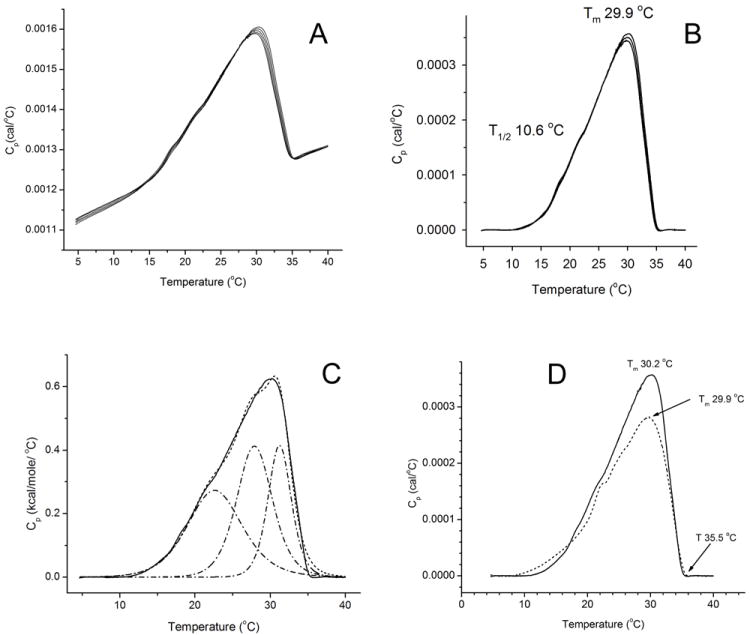
Meibomian gland secretions (or meibum) are produced by holocrine meibomian glands and are secreted in melted form onto the ocular surface of humans and animals to form a protective tear film lipid layer (TFLL). Its protective effect strongly depends on the composition and, hence, thermotropic behavior of meibum. The goal of our study was to quantitatively evaluate the melting characteristics of human meibum and model lipid mixtures using differential scanning microcalorimetry. Standard calorimetric parameters, e.g. changes in calorimetric enthalpy, transition temperatures Tm, cooperativity of melting, etc. were assessed. We found that thermotropic behavior of meibum resembled that of relatively simple mixtures of unsaturated wax esters, but showed a lower change in calorimetric enthalpy, which can be indicative of a looser packing of lipids in meibum compared with pure standards and their simple mixtures. The cooperativity of melting of meibomian lipids was comparable to that of an equimolar mixture of four oleic-acid based wax esters. We demonstrated that the phase transitions in meibum start at about 10-15°C and end at 35-36°C, with Tm being about 30°C. The highly asymmetrical shape of the thermotropic peak of meibum is important for the physiology and biophysics of TFLL.
Copyright © 2013 Elsevier Ireland Ltd. All rights reserved.
Figures


Similar articles
-
Human meibum lipid conformation and thermodynamic changes with meibomian-gland dysfunction.Invest Ophthalmol Vis Sci. 2011 Jun 1;52(6):3805-17. doi: 10.1167/iovs.10-6514. Invest Ophthalmol Vis Sci. 2011. PMID: 21398284 Free PMC article. Clinical Trial.
-
An investigation of the likely role of (O-acyl) ω-hydroxy fatty acids in meibomian lipid films using (O-oleyl) ω-hydroxy palmitic acid as a model.Exp Eye Res. 2013 Oct;115:57-64. doi: 10.1016/j.exer.2013.06.016. Epub 2013 Jun 21. Exp Eye Res. 2013. PMID: 23792170
-
Temperature-induced transitions in the structure and interfacial rheology of human meibum.Biophys J. 2012 Jan 18;102(2):369-76. doi: 10.1016/j.bpj.2011.12.017. Biophys J. 2012. PMID: 22339874 Free PMC article.
-
Lipidomics of human Meibomian gland secretions: Chemistry, biophysics, and physiological role of Meibomian lipids.Prog Lipid Res. 2011 Jul;50(3):278-301. doi: 10.1016/j.plipres.2011.03.003. Epub 2011 Mar 31. Prog Lipid Res. 2011. PMID: 21458488 Free PMC article. Review.
-
The real reason for having a meibomian lipid layer covering the outer surface of the tear film - A review.Exp Eye Res. 2015 Aug;137:125-38. doi: 10.1016/j.exer.2015.05.002. Epub 2015 May 14. Exp Eye Res. 2015. PMID: 25981748 Review.
Cited by
-
A role for ELOVL4 in the mouse meibomian gland and sebocyte cell biology.Invest Ophthalmol Vis Sci. 2014 May 1;55(5):2832-40. doi: 10.1167/iovs.13-13335. Invest Ophthalmol Vis Sci. 2014. PMID: 24677106 Free PMC article.
-
Comparative Biophysical Study of Meibomian Lipids of Wild Type and Soat1-Null Mice: Implications to Meibomian Gland Dysfunction and Dry Eye Disease.Invest Ophthalmol Vis Sci. 2023 Aug 1;64(11):20. doi: 10.1167/iovs.64.11.20. Invest Ophthalmol Vis Sci. 2023. PMID: 37585190 Free PMC article.
-
The optimum temperature for the heat therapy for meibomian gland dysfunction.Ocul Surf. 2019 Apr;17(2):360-364. doi: 10.1016/j.jtos.2019.02.005. Epub 2019 Feb 19. Ocul Surf. 2019. PMID: 30794947 Free PMC article.
-
Physiological effects of inactivation and the roles of Elovl3/ELOVL3 in maintaining ocular homeostasis.FASEB J. 2021 Feb;35(2):e21327. doi: 10.1096/fj.202002323R. FASEB J. 2021. PMID: 33455016 Free PMC article.
-
Biophysical properties of tear film lipid layer I. Surface tension and surface rheology.Biophys J. 2022 Feb 1;121(3):439-450. doi: 10.1016/j.bpj.2021.12.033. Epub 2021 Dec 24. Biophys J. 2022. PMID: 34958775 Free PMC article.
References
-
- The definition and classification of dry eye disease: Report of the definition and classification subcommittee of the international dry eye workshop (2007) The ocular surface. 2007a;5:75–92. - PubMed
-
- The lipid handbook. 3. CRC Press, Taylor & Francis Group; 2007b.
-
- Arita R, Itoh K, Maeda S, Maeda K, Furuta A, Fukuoka S, Tomidokoro A, Amano S. Proposed diagnostic criteria for obstructive meibomian gland dysfunction. Ophthalmology. 2009;116:2058–2063. e2051. - PubMed
Publication types
MeSH terms
Substances
Grants and funding
LinkOut - more resources
Full Text Sources
Other Literature Sources
