. 2013 Jun;27(6):925-39.
doi: 10.1210/me.2012-1369. Epub 2013 Apr 11.

SULT2B1b sulfotransferase: induction by vitamin D receptor and reduced expression in prostate cancer

Affiliations

SULT2B1b sulfotransferase: induction by vitamin D receptor and reduced expression in prostate cancer

Young-Kyo Seo et al. Mol Endocrinol. 2013 Jun.

Abstract

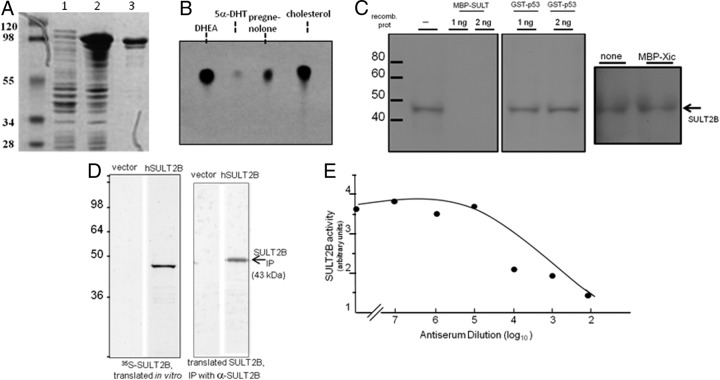
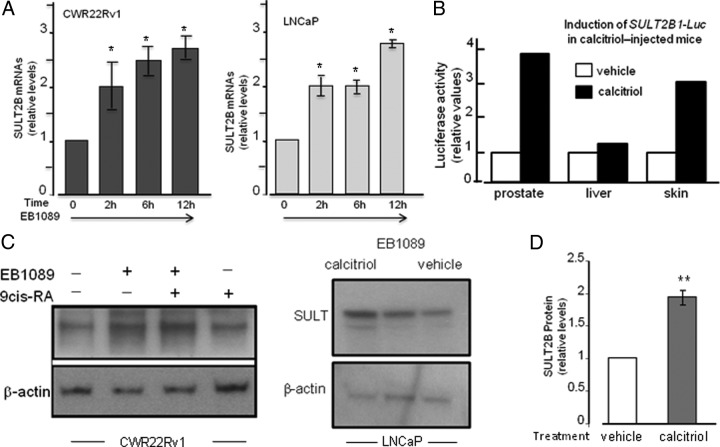
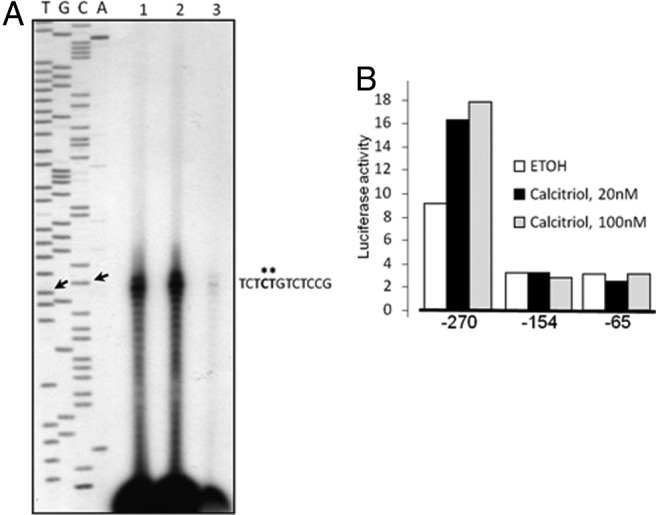
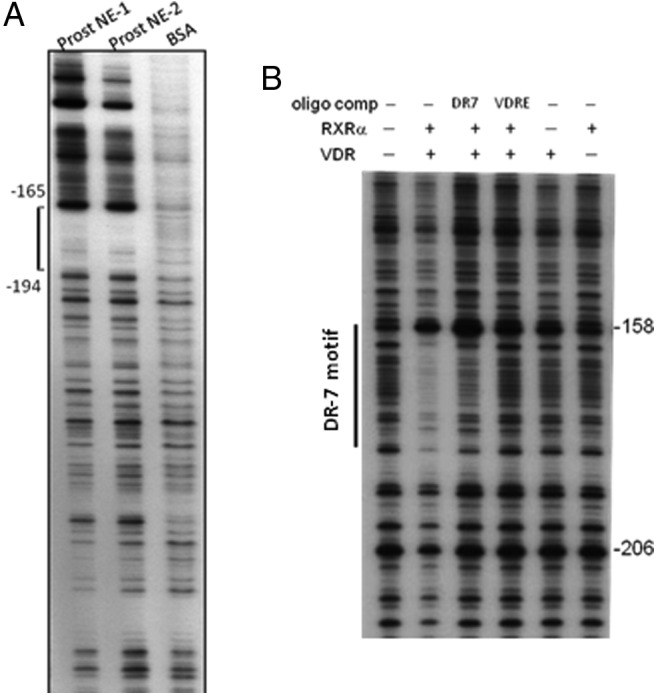
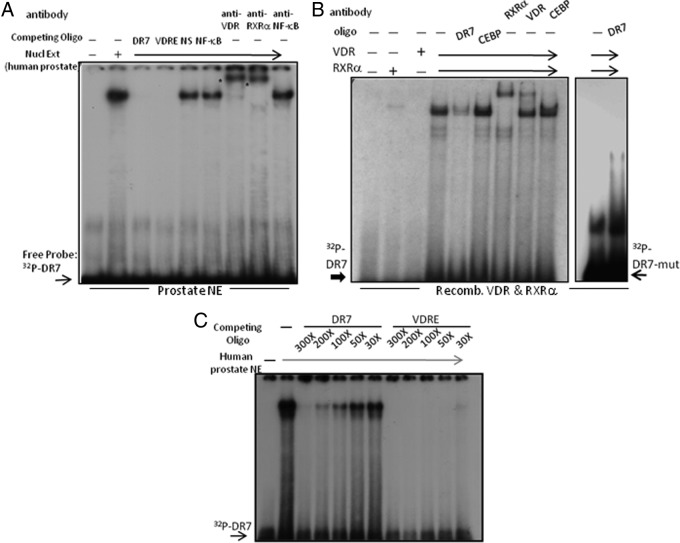
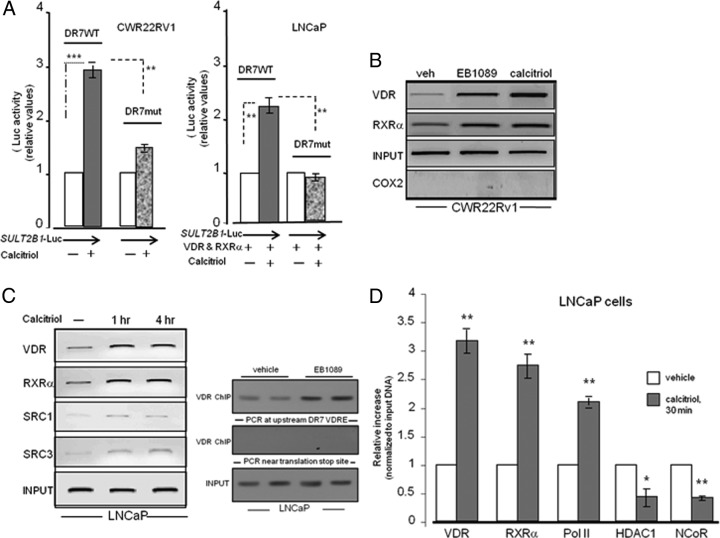
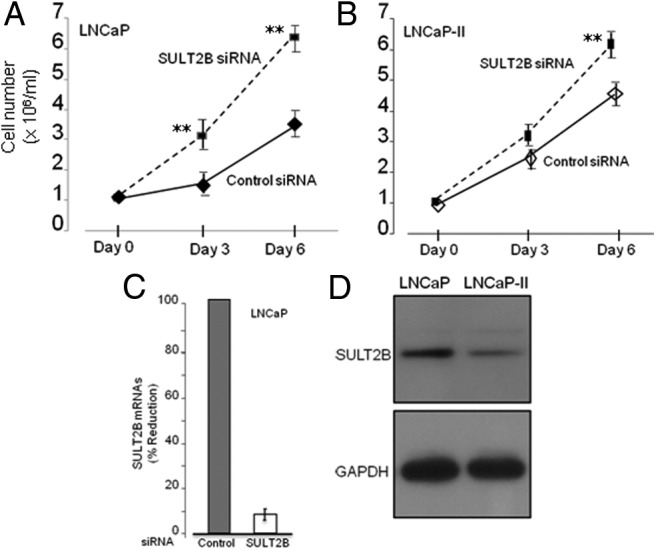
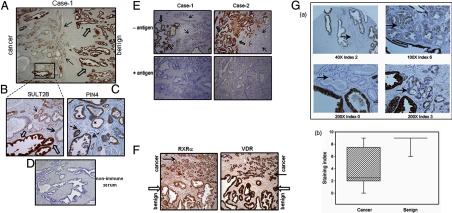
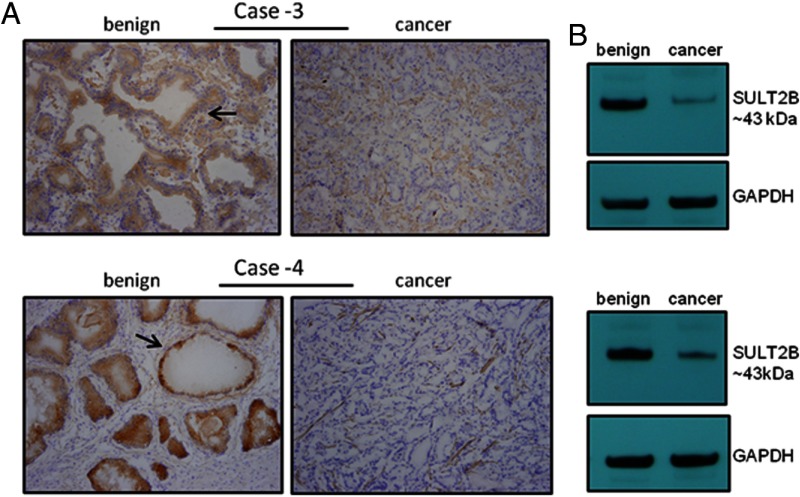
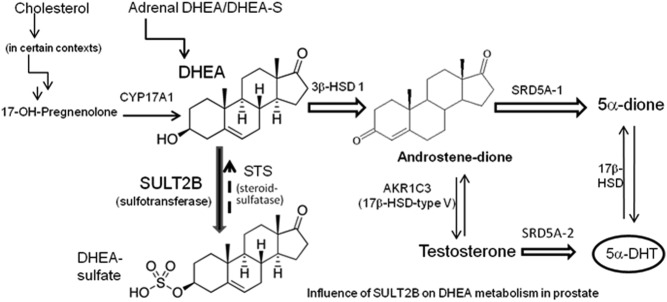
An elevated tumor tissue androgen level, which reactivates androgen receptor in recurrent prostate cancer, arises from the intratumor synthesis of 5α-dihydrotestosterone through use of the precursor steroid dehydroepiandrosterone (DHEA) and is fueled by the steroidogenic enzymes 3β-hydroxysteroid dehydrogenase (3β-HSD1), aldoketoreductase (AKR1C3), and steroid 5-alpha reductase, type 1 (SRD5A1) present in cancer tissue. Sulfotransferase 2B1b (SULT2B1b) (in short, SULT2B) is a prostate-expressed hydroxysteroid SULT that converts cholesterol, oxysterols, and DHEA to 3β-sulfates. DHEA metabolism involving sulfonation by SULT2B can potentially interfere with intraprostate androgen synthesis due to reduction of free DHEA pool and, thus, conversion of DHEA to androstenedione. Here we report that in prostatectomy specimens from treatment-naive patients, SULT2B expression is markedly reduced in malignant tissue (P < .001, Mann-Whitney U test) compared with robust expression in adjacent nonmalignant glands. SULT2B was detected in formalin-fixed specimens by immunohistochemistry on individual sections and tissue array. Immunoblotting of protein lysates of frozen cancer and matched benign tissue confirmed immunohistochemistry results. An in-house-developed rabbit polyclonal antibody against full-length human SULT2B was validated for specificity and used in the analyses. Ligand-activated vitamin D receptor induced the SULT2B1 promoter in vivo in mouse prostate and increased SULT2B mRNA and protein levels in vitro in prostate cancer cells. A vitamin D receptor/retinoid X receptor-α-bound DNA element (with a DR7 motif) mediated induction of the transfected SULT2B1 promoter in calcitriol-treated cells. SULT2B knockdown caused an increased proliferation rate of prostate cancer cells upon stimulation by DHEA. These results suggest that the tumor tissue SULT2B level may partly control prostate cancer growth, and its induction in a therapeutic setting may inhibit disease progression.


Figures

Figure 1.
Figure 1.
Recombinant SULT2B expression, its activity, and validation of a rabbit polyclonal anti-SULT2B antibody. A, A full-length human SULT2B1b cDNA, expressed downstream of the MBP in E. coli BL21 and analyzed on 6% SDS-PAGE. Uninduced (lane 1) and IPTG-induced (lane 2) bacterial lysate are shown. In lane 3 is amylose resin-purified MBP-SULT2B (∼85.5 kDa). B, Autoradiogram of the TLC-resolved 35S-labeled sulfated steroids generated in the reaction mixture of [35S]PAPS indicated steroids and recombinant SULT2B. C, Antibody neutralization by the antigen. Samples of LNCaP cell lysate were Western blotted (4%–20% gradient gel) with the SULT2B antibody either without preincubation or after preincubation with MBP-SULT or the unrelated recombinant GST-p53 or MBP-Xic protein (Xic is a Xenopus CDK inhibitor). Molecular weight markers are shown. D, 35S-labeled in vitro-translated 43-kDa human SULT2B (left panel) and the anti-SULT2B antibody-directed immunoprecipitate from the in vitro-transcribed and translated SULT2B cDNA (right panel); 10% SDS-PAGE was used. E, Inhibition of SULT2B activity on the DHEA substrate by the anti-SULT2B antibody. The enzymatic reaction was performed in the presence of [35S]PAPS, and activity was quantified from the radioactivity of [35S]DHEA. Each point is the average of 2 independent assays.
Figure 2.
Figure 2.
Cacitriol-mediated induction of the SULT2B mRNA and protein. A, SULT2B mRNAs analyzed by quantitative RT-PCR. CWR22Rv1and LNCaP cells were treated with 20nM EB1089. Induction at each time point reflects average values from 3 independent experiments, with each histogram shown as average ± SEM. *, P < .05. B, Calcitriol-mediated induction of the human SULT2B1 promoter in mouse prostate. Firefly luciferase activity expressed from the SULT2B1-Luc reporter was normalized to constitutively expressed Renilla luciferase activity. The average of fold increase from 2 experimental series is shown. C, Western blotting of (10% SDS-PAGE) lysate samples from vehicle- and calcitriol/EB1089-treated CWR22Rv1 and LNCaP cells. LNCaP cells were cultured in 2% serum that was not charcoal stripped. CWR22Rv1 cells were treated with EB1089 and 9-cis retinoic acid (RA) singly or concurrently. For vehicle, treatment was with 0.001% ethanol. D, Calcitriol-mediated induction of SULT2B in LNCaP cells was quantified from the Western blot analysis of 3 independent experiments. Signals in x-ray films were quantified using ImageJ software. The bar graph shows fold induction ± SEM. **, P ≤ .02.
Figure 3.
Figure 3.
Transcription start sites and vitamin D-responsive region in the SULT2B1 gene. A, Primer extension assay. The 5′ 32P-labeled primer sequence 5′-GCCAGAGACCTTGAGAGACGCAACA-3′ (+4366 to +4390, NCBI ref seq NG_029063.1) was extended at the 3′ end by reverse transcription. Lanes 1 and 2, total LNCaP cell RNAs at 20 μg (lane 1) and 30 μg (lane 2); lane 3, 20 μg tRNAs (negative control). Reverse-transcribed cDNAs and the sequencing ladder were run on 6% sequencing gel. C and T nucleotides, marked with asterisks, are primary transcription start positions. B, A calcitriol-responsive region in the SULT2B1 promoter. Normalized firefly luciferase activities expressed from the SULT2B1-Luc reporter plasmids, were compared for 5′-deleted promoter fragments. Each bar is theaverage from 2 independent transfections, each in duplicate. Vehicle was 0.001% ethanol (EtOH).
Figure 4.
Figure 4.
DNase1 footprinting of a SULT2B1 promoter fragment. A, Footprint by human prostate nuclear extracts (Prost NE). Two different prostate samples were used. B, Footprint in the presence of recombinant VDR and RXRα. Competition footprinting was conducted with DR7 (lane 3) and VDRE (lane 4). Comp, competitor.
Figure 5.
Figure 5.
EMSA complex with DR7 sequence in the SULT2B1 promoter. A, EMSA of 32P-labeled DR7 with human prostate nuclear extract (NuclExt or NE). Competition was at 100-fold molar excess with unlabeled DR7 (lane 3), VDRE, osteocalcin promoter (lane 4), NS, a nonspecific sequence (lane 5), and nuclear factor (NF)-κB element (lane 6). Antibody supershift was performed with anti-VDR (lane 7), anti-RXRα (lane 8), and anti-C/EBP (lane 9). B, EMSA of 32P-labeled DR7 with recombinant VDR and RXRα: left panel, oligo competition and antibody supershift assays were performed as shown; right panel, mutant DR7 did not yield EMSA complex with recombinant VDR and RXRα. C, Competition of the unlabeled DR7 and VDRE for the EMSA complex of [32P]DR7 with prostate nuclear extract.
Figure 6.
Figure 6.
DR7-mediated SULT2B1 promoter induction and association of DR7 in the chromatin with VDR/RXRα, detected by ChIP. A, Luciferase expression from the transfected SULT2B1-Luc plasmid carrying the wild-type or mutant DR7 sequence. Each bar is the average ± SEM from 4 independent assays. ***, P = .004; **, P ≤ .02. B–D, ChIP assays. B, CWR22Rv1 cells were treated with EB1089 or calcitriol for 1 hour. The COX2 antibody was a negative control. PCR primers for the amplification of immunoprecipitated DNAs are described in Materials and Methods. C, LNCaP cells, treated with calcitriol (1 and 4 hours): right panel (middle), no PCR signal for VDR ChIP with primers from the translation stop site of SULT2B1. D, ChIP-qPCR for VDR, RXRα, Pol II, HDAC1, and NCoR. Cells were treated with calcitriol or vehicle (0.001%) for 30 minutes. Values (average ± SEM) are from 3 independent ChIP assays, normalized to input DNA signal. Equal amounts of input DNA were used from solubilized chromatin samples of vehicle- and calcitriol-treated cells. *, P < .05; **, P ≤ .002.
Figure 7.
Figure 7.
Increased proliferation of DHEA-stimulated LNCaP cells depleted of SULT2B. A, LNCaP cell line. B, LNCaP-II cell line, which is a variant of the original LNCaP line. Each data point represents the average of trypan blue-excluded cells ± SEM from values in 4 experiments. Cell numbers for silenced vs nonsilenced cells differed significantly for LNCaP cells at days 3 and 6 and for LNCaP-II cells at day 6 (**, P ≤ .01). The cell number difference did not reach statistical significance for LNCaP-II cells cultured for 3 days (P = .117). Cells in 5% CSS were transfected with control siRNA or 10nM SULT2B siRNA pool (sc-44399; Santa Cruz Biotechnology) for 5 hours using Oligofectamine (Dharmacon). At 5 hours after siRNA treatment, DHEA (100nM) was added to the media (in CSS) every 2 days. C, Silencing of SULT2B1b mRNAs in siRNA-treated LNCaP cells, analyzed by quantitative RT-PCR. The analysis was on vehicle-treated cells. D, Endogenous SULT2B levels in LNCaP and LNCaP-II cells analyzed by Western blotting (4%–20% gradient gel). The membrane was reprobed for glyceraldehyde 3-phosphate dehydrogenase (GAPDH).
Figure 8.
Figure 8.
SULT2B levels in prostate cancer analyzed by IHC. Treatment-naive primary prostate tumors were analyzed. A–D, IHC of a formalin-fixed specimen (case 1) using antibodies as indicated: A, anti-SULT2B antibody characterized in Figure 1, with open arrows indicating SULT2B staining of benign acini and solid arrows indicating loss of SULT2B staining in cancerous foci; B, enlarged photomicrograph of the boxed area of A; C, PIN4 antibody cocktail, with dashed arrows showing immunostained p63, CK5, and CK14 of the intact basal epithelium and asterisks indicating the loss of basal epithelial staining and luminal epithelial staining for racemase in cancer foci; D, nonimmune rabbit sera (IgG). E, Specific immunostaining for SULT2B in specimens from case 1 and a second specimen (case 2). The upper 2 panels show that in the absence of absorption by the recombinant antigen (MBP-SULT2B), the antibody produced SULT2B immunostaining in normal-appearing acini (open arrows) but not in cancer foci (solid arrows). Upon preincubation of the antibody with the antigen, SULT2B immunostaining was completely lost (lower panels). Photomicrographs are at a magnification of 40×. F, A positive control experiment based on IHC with anti-VDR and anti-RXRα antibodies. Both malignant and nonmalignant glands stained positively for the 2 nuclear receptors. G, Tissue microarrays containing prostate cancer specimens, analyzed by IHC: a, examples of IHC with the anti-SULT2B antibody, with the original magnification and staining index for the cancer indicated under each panel and arrows pointing to the cancer (the normal tissue in the ×40 photo had a staining index of 6; the remaining normal tissues all had a staining index of 9); b, box plot of staining index of prostate cancer and benign tissues. The difference in staining index was highly statistically significant (P < .001, Mann-Whitney U test).
Figure 9.
Figure 9.
Immunoblotted SULT2B in matched tumor and nontumor tissues in frozen specimens. A, IHC of frozen sections with anti-SULT2B antibody. Arrows show stained nonmalignant glands. B, Western blotting of SULT2B (10% SDS-PAGE) from samples of total lysate prepared from nontumor and tumor regions. The membrane was reprobed for glyceraldehyde 3-phosphate dehydrogenase (GAPDH) (normalizing control).
Figure 10.
Figure 10.
Schema showing a potential role for SULT2B in androgen homeostasis. Abundant SULT2B expression would limit conversion of DHEA to androstenedione. Loss of SULT2B in prostate cancer tumor tissue facilitates androstenedione production, which would elevate DHT levels (via 5α-dione and testosterone) and stimulate androgen-driven growth of prostate cancer. 3β-hydroxysteroid dehydrogenase (3β-HSD1), aldoketoreductase 1C3, (AKR1C3), and steroid 5α-reductase, type 1 (SRD5A1), the enzymes mediating DHEA and androstenedione metabolism, are frequently up-regulated in advanced prostate cancer (3, 6).

Similar articles

Cited by

References

    1. de Bono JS, Logothetis CJ, Molina A, et al. Abiraterone and increased survival in metastatic prostate cancer. N Engl J Med. 2011;364:1995–2005 - PMC - PubMed
    1. Tran C, Ouk S, Clegg NJ, et al. Development of a second-generation antiandrogen for treatment of advanced prostate cancer. Science. 2009;324:787–790 - PMC - PubMed
    1. Hofland J, van Weerden WM, Dits NF, et al. Evidence of Limited contributions for intratumoral steroidogenesis in prostate cancer. Cancer Res. 2010;70:1256–1264 - PubMed
    1. Chang KH, Li R, Papari-Zareei M, et al. Dihydrotestosterone synthesis bypasses testosterone to drive castration-resistant prostate cancer. Proc Natl Acad Sci U S A. 2011;108:13728–13733 - PMC - PubMed
    1. Hofland J, van Weerden WM, Jenster G, Schröder FH, de Jong FH. Intraprostatic steroidogenic enzymes: response. Cancer Res. 2010;70:8249–8250

Publication types

MeSH terms