Survivors versus nonsurvivors postburn: differences in inflammatory and hypermetabolic trajectories
- PMID: 23579577
- PMCID: PMC3732513
- DOI: 10.1097/SLA.0b013e31828dfbf1
Survivors versus nonsurvivors postburn: differences in inflammatory and hypermetabolic trajectories
Abstract
Objective: To evaluate whether a panel of common biomedical markers can be utilized as trajectories to determine survival in pediatric burn patients.
Background: Despite major advances in clinical care, of the more than 1 million people burned in the United States each year, more than 4500 die as a result of their burn injuries. The ability to predict patient outcome or anticipate clinical trajectories using plasma protein expression would allow personalization of clinical care to optimize the potential for patient survival.
Methods: A total of 230 severely burned children with burns exceeding 30% of the total body surface, requiring at least 1 surgical procedure were enrolled in this prospective cohort study. Demographics, clinical outcomes, and inflammatory and acute-phase responses (serum cytokines, hormones, and proteins) were determined at admission and at 11 time points for up to 180 days postburn. Statistical analysis was performed using a 1-way analysis of variance, the Student t test, χ test, and Mann-Whitney test where appropriate.
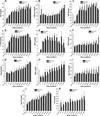
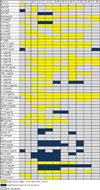
Results: Survivors and nonsurvivors exhibited profound differences in critical markers of inflammation and metabolism at each time point. Nonsurvivors had significantly higher serum levels of interleukin (IL)-6, IL-8, granulocyte colony-stimulating factor, monocyte chemoattractant protein-1, C-reactive protein, glucose, insulin, blood urea nitrogen, creatinine, and bilirubin (P < 0.05). Furthermore, nonsurvivors exhibited a vastly increased hypermetabolic response that was associated with increases in organ dysfunction and sepsis when compared with survivors (P < 0.05).
Conclusions: Nonsurvivors have different trajectories in inflammatory, metabolic, and acute phase responses allowing differentiation of nonsurvivors from survivors and now possibly allowing novel predictive models to improve and personalize burn outcomes.
Conflict of interest statement
Figures


References
-
- Herndon DN, Tompkins RG. Support of the metabolic response to burn injury. Lancet. 2004;363:1895–1902. - PubMed
Publication types
MeSH terms
Substances
Grants and funding
- 123336/CAPMC/ CIHR/Canada
- KL2 RR029875/RR/NCRR NIH HHS/United States
- KL2RR029875/RR/NCRR NIH HHS/United States
- UL1 TR000071/TR/NCATS NIH HHS/United States
- P50 GM060338/GM/NIGMS NIH HHS/United States
- R01 GM56687/GM/NIGMS NIH HHS/United States
- T32 GM008256/GM/NIGMS NIH HHS/United States
- R01 GM087285/GM/NIGMS NIH HHS/United States
- KL2 TR000072/TR/NCATS NIH HHS/United States
- H133 A070026/PHS HHS/United States
- P50 GM60338/GM/NIGMS NIH HHS/United States
- R01 GM056687/GM/NIGMS NIH HHS/United States
- UL1 RR029876/RR/NCRR NIH HHS/United States
- UL1RR029876/RR/NCRR NIH HHS/United States
LinkOut - more resources
Full Text Sources
Other Literature Sources
Medical
Research Materials

