. 2013 Apr 11;14(4):7959-78.
doi: 10.3390/ijms14047959.

Specific siRNA targeting receptor for advanced glycation end products (RAGE) decreases proliferation in human breast cancer cell lines

Affiliations

Specific siRNA targeting receptor for advanced glycation end products (RAGE) decreases proliferation in human breast cancer cell lines

Al-Madhagi Radia et al. Int J Mol Sci. .

Abstract

Receptor for Advanced Glycation End Products (RAGE) is an oncogenic trans-membranous receptor overexpressed in various human cancers. However, the role of RAGE in breast cancer development and proliferation is still unclear. In this study, we demonstrated that RAGE expression levels are correlated to the degree of severity of breast cancer. Furthermore, there is a decrease in the proliferation of all sub-types of breast cancer, MCF-7, SK-Br-3 and MDA-MB-231, as a result of the effect of RAGE siRNA. RAGE siRNA arrested cells in the G1 phase and inhibited DNA synthesis (p < 0.05). Moreover, qRT-PCR and Western Blot results demonstrated that RAGE siRNA decreases the expression of transcriptional factor NF-κB p65 as well as the expression of cell proliferation markers PCNA and cyclinD1. RAGE and RAGE ligands can thus be considered as possible targets for breast cancer management and therapy.


Figures

Figure 1
Figure 1
RAGE mRNA and protein expression (normalized to β-actin expression) in MCF-7, SK-Br-3, MDA-MB-231 cell lines analyzed by (A) qRT-PCR and (B) Western Blot. The results indicate that RAGE expression in MDA-MB-231 was significantly higher than in MCF-7 and SK-Br-3; (# p < 0.05). Three independent measurements were performed and averaged.
Figure 2
Figure 2
RAGE siRNA silencing efficiency by (a) qRT-PCR (*, **, # p < 0.05) and (b) Western Blot (p < 0.05). The results showed decreased expression of RAGE mRNA and protein in the siRNA group compared to the negative control and blank control groups. Three independent measurements were performed and averaged.
Figure 3
Figure 3
MTT [3-(4,5-dimethylthiazol-2-yl)-2,5-diphenyltetrazolium bromide] colorimetric result. RAGE siRNA inhibits proliferation in all cell lines (*, **, # p < 0.05). The highest growth inhibition is achieved after 48 h of incubation with RAGE siRNA. Three independent measurements were performed and averaged.
Figure 4
Figure 4
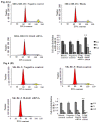
FACS flow cytometry staining studies in MCF-7, SK-Br-3 and MDA-MB-231 cell lines after treatment with RAGE siRNA. RAGE siRNA inhibited DNA synthesis, significantly increased the percentage of cells in G1 phase and significantly decreased the percentage of cells in the S and G2 phases 48 h post-treatment. In MDA-MB-231 (*, **, # p < 0.05) and SK-Br-3 (*, **, # p < 0.05) 3.2–6.4 μg of siRNA were needed to obtain significant results; however, MCF-7 (*, **, # p < 0.05) required 9.6 μg of siRNA to achieve a significant result. Three independent measurements were performed and averaged.
Figure 4
Figure 4
FACS flow cytometry staining studies in MCF-7, SK-Br-3 and MDA-MB-231 cell lines after treatment with RAGE siRNA. RAGE siRNA inhibited DNA synthesis, significantly increased the percentage of cells in G1 phase and significantly decreased the percentage of cells in the S and G2 phases 48 h post-treatment. In MDA-MB-231 (*, **, # p < 0.05) and SK-Br-3 (*, **, # p < 0.05) 3.2–6.4 μg of siRNA were needed to obtain significant results; however, MCF-7 (*, **, # p < 0.05) required 9.6 μg of siRNA to achieve a significant result. Three independent measurements were performed and averaged.
Figure 5
Figure 5
Effect of RAGE siRNA on apoptosis of (a) MDA-MB-231; (b) SK-Br-3; (c) MCF-7 breast cancers cell lines. Transfected cells were stained with Annexine-V and Propidium iodide followed by flow cytometry. Early apoptotic (right bottom), late apoptotic (right top) and necrotic (left top) cells were displayed. Three independent measurements were performed and averaged and no significant difference was detected.
Figure 5
Figure 5
Effect of RAGE siRNA on apoptosis of (a) MDA-MB-231; (b) SK-Br-3; (c) MCF-7 breast cancers cell lines. Transfected cells were stained with Annexine-V and Propidium iodide followed by flow cytometry. Early apoptotic (right bottom), late apoptotic (right top) and necrotic (left top) cells were displayed. Three independent measurements were performed and averaged and no significant difference was detected.
Figure 6
Figure 6
There was decreased expression of PCNA mRNA after transfection with RAGE siRNA as shown by qRT-PCR in MDA-MB-231 (a), SK-Br-3 (b) and MCF-7 (c) cell lines respectively (*, **, # p < 0.05) and Western Blot results (f) (p < 0.05) compared to the negative or blank control groups. Comparison between the expression of PCNA in the three cell lines in the control groups (d) and in the transfected groups (e). Three independent measurements were performed and averaged.
Figure 6
Figure 6
There was decreased expression of PCNA mRNA after transfection with RAGE siRNA as shown by qRT-PCR in MDA-MB-231 (a), SK-Br-3 (b) and MCF-7 (c) cell lines respectively (*, **, # p < 0.05) and Western Blot results (f) (p < 0.05) compared to the negative or blank control groups. Comparison between the expression of PCNA in the three cell lines in the control groups (d) and in the transfected groups (e). Three independent measurements were performed and averaged.
Figure 7
Figure 7
There was decreased expression of CyclinD1 mRNA after transfection with RAGE siRNA as shown by qRT-PCR in MDA-MB-231 (a), SK-Br-3 (b) and MCF-7 (c) cell lines respectively (*, **, # p < 0.05) and Western Blot results (f) (p < 0.05) compared to the negative or blank control groups. Comparison between the expression of CyclinD1 in the three cell lines in the control groups (d) and in the transfected groups (e). Three independent measurements were performed and averaged.
Figure 7
Figure 7
There was decreased expression of CyclinD1 mRNA after transfection with RAGE siRNA as shown by qRT-PCR in MDA-MB-231 (a), SK-Br-3 (b) and MCF-7 (c) cell lines respectively (*, **, # p < 0.05) and Western Blot results (f) (p < 0.05) compared to the negative or blank control groups. Comparison between the expression of CyclinD1 in the three cell lines in the control groups (d) and in the transfected groups (e). Three independent measurements were performed and averaged.
Figure 8
Figure 8
There was decreased expression of NF-κB p65 mRNA after transfection with RAGE siRNA as shown by qRT-PCR in MDA-MB-231 (a), SK-Br-3 (b) and MCF-7 (c) cell lines respectively (*, **, # p < 0.05) and Western Blot results (f) (p < 0.05) compared to the negative or blank control groups. Comparison between the expression of NF-κB p65 in the three cell lines in the control groups (d) and in the transfected groups (e). Three independent measurements were performed and averaged.
Figure 8
Figure 8
There was decreased expression of NF-κB p65 mRNA after transfection with RAGE siRNA as shown by qRT-PCR in MDA-MB-231 (a), SK-Br-3 (b) and MCF-7 (c) cell lines respectively (*, **, # p < 0.05) and Western Blot results (f) (p < 0.05) compared to the negative or blank control groups. Comparison between the expression of NF-κB p65 in the three cell lines in the control groups (d) and in the transfected groups (e). Three independent measurements were performed and averaged.

Similar articles

Cited by

References

    1. Poellinger A. Near-infrared imaging of breast cancer using optical contrast agents. J. Biophotonics. 2012;5:815–826. - PubMed
    1. Smolarek A.K., Suh N. Chemopreventive activity of vitamin E in breast cancer. A focus on ã- and ä-Tocopherol. Nutrients. 2011;3:962–986. - PMC - PubMed
    1. Beckmann M.W., Niederacher D., Schnurch H.G., Gusterson B.A., Bender H.G. Multistep carcinogenesis of breast cancer and tumor heterogeneity. J. Mol. Med. 1997;75:429–439. - PubMed
    1. Lerebours F., Lidereau R. Molecular alterations in sporadic breast cancer. Crit. Rev. Oncol. Hematol. 2002;44:121–141. - PubMed
    1. Balmain A., Gray J., Ponder B. The genetics and genomics of cancer. Nat. Genet. 2003;33:238– 244. - PubMed

Publication types

MeSH terms